Create Reverse Joinin Pipeline.
Introduction
The pipeline is a new type of dataset added to the OPNBI Application. Users can define the relationships between different datasets as well as tables with user-friendly UI. With Pipeline, no SQL knowledge is needed to provide join between tables and datasets available in OPNBI. Earlier, to join Tables to get combined data from various tables user has to write SQL Queries and it requires a good understanding of SQL Queries to do so. One who knows how to write SQL Queries can only able to get data from the source so Business users are dependent on a person who knows SQL. It is no longer the case when you use Pipeline to fetch data and apply joins between tables with the drag and drop facility provided in Pipeline.
Prerequisites
To create Reverse Join Pipeline, you need working Datasets(JDBC) and a list of tables and views.
Objective
How to create reverse Join in Pipeline.
Download Pipeline.zip file from the link given Pipeline.zip
Follow steps to create Reverse Join Pipeline in OPNBI:-
Login to the OPNBI application with valid user credentials.
Go to Master Data > Dataset section from the Hamburger menu.
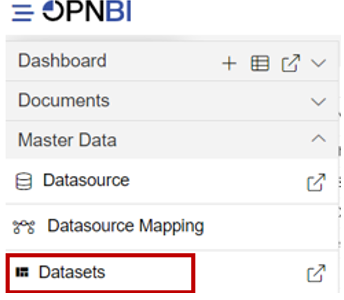
Go to the Dataset section, Click on Create Pipeline from the bottom menu bar. As shown in the figure below:

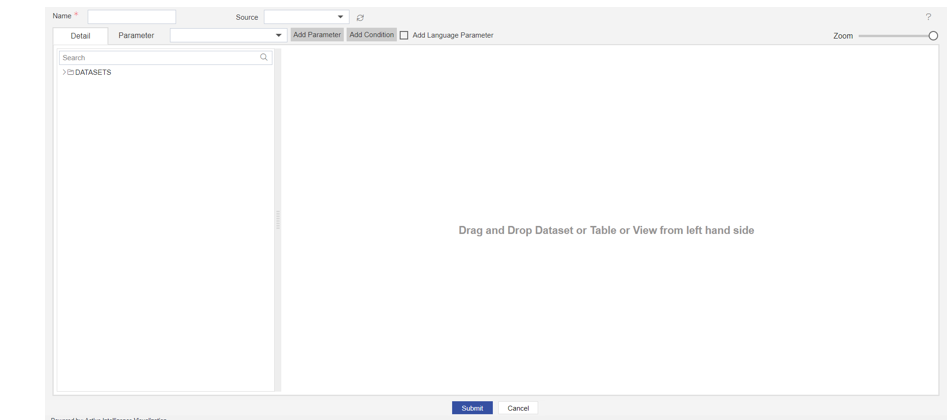
Once you click, you can see a blank create pipeline window as in the below image:
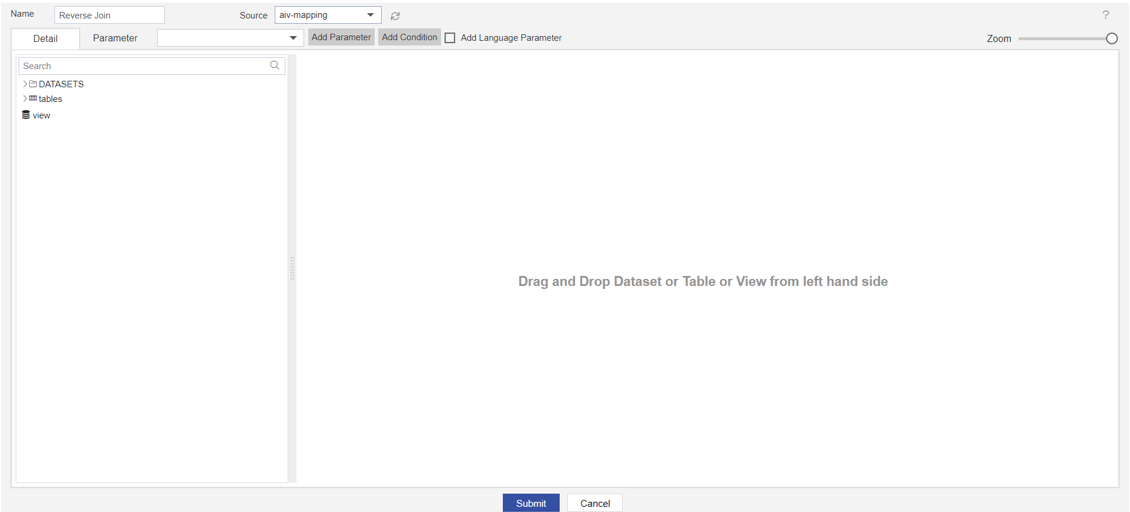
Enter the Following detail in the Pipeline dialog box:
Name: Reverse Join
Source: OPNBI-mapping
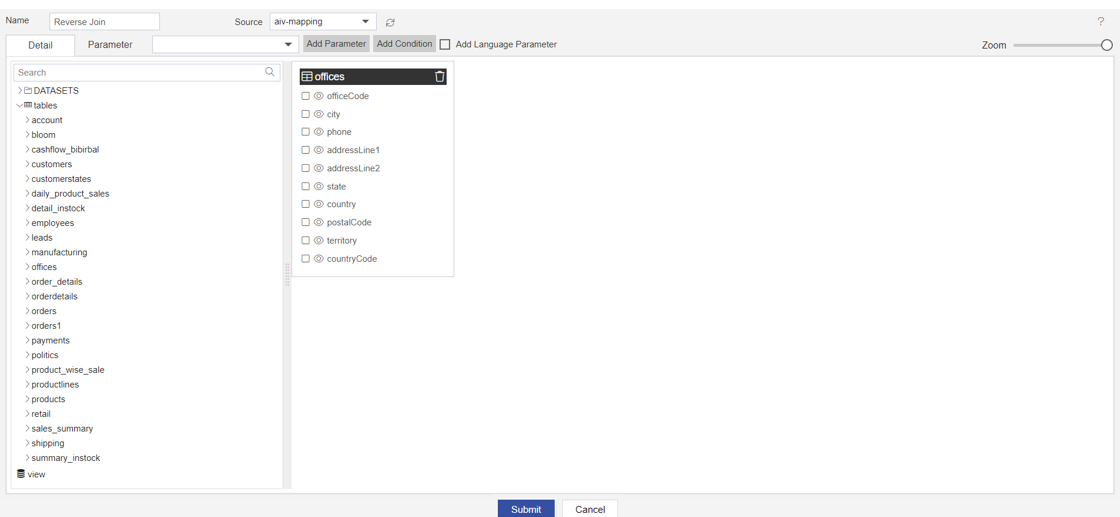
Expand tables from the left side table view, As shown in the figure below:
Drag and Drop the OFFICE table from the table box and drag to the diagram box on the right side, and select all the columns from the Select Column dialog box, as shown in the figure below:
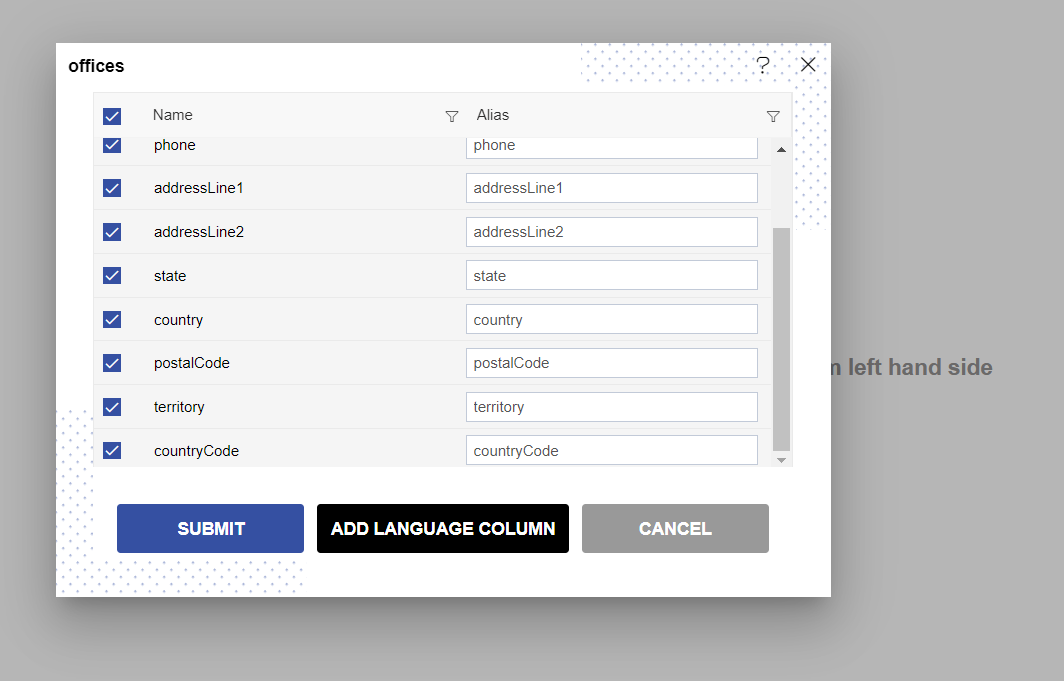
Click on Submit button, after dragging & drop the OFFICE table in the diagram box, look like the figure below:
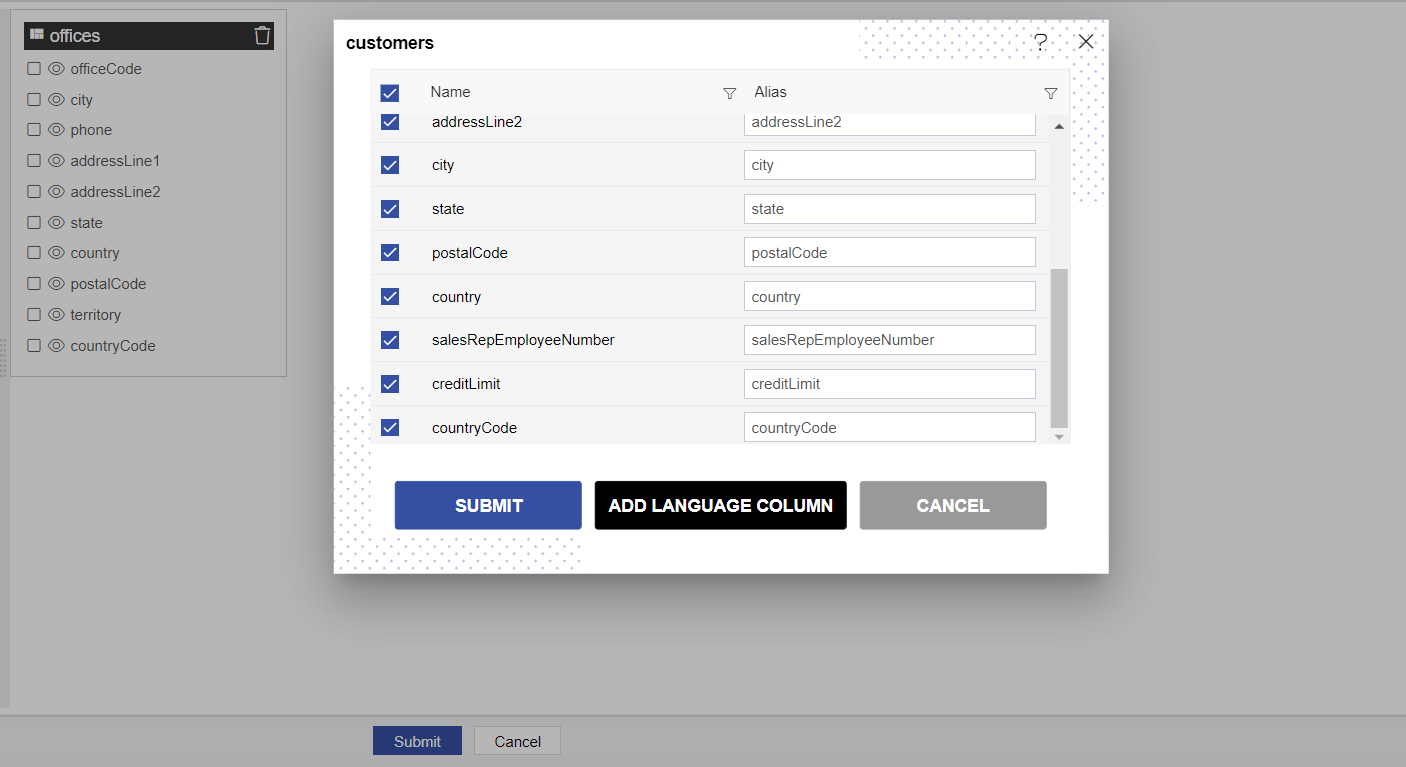
Drag and drop the second table, take the CUSTOMERS table, and drop it in the diagram box.
After dropping the CUSTOMERS table, select all the columns from the Select Columns dialog box, as shown in the figure below:
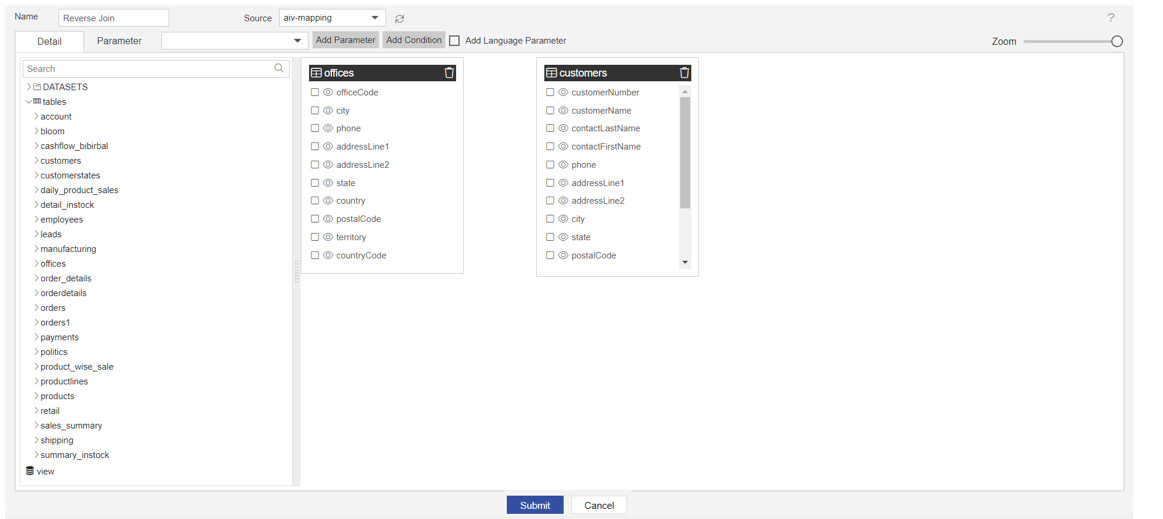
Click on submit button, offices and customers table from the diagram box will look like the figure below:
After adding OFFICES and CUSTOMERS from the table list, Drag the COUNTRY column from Customers to Offices, as shown in the figure below:
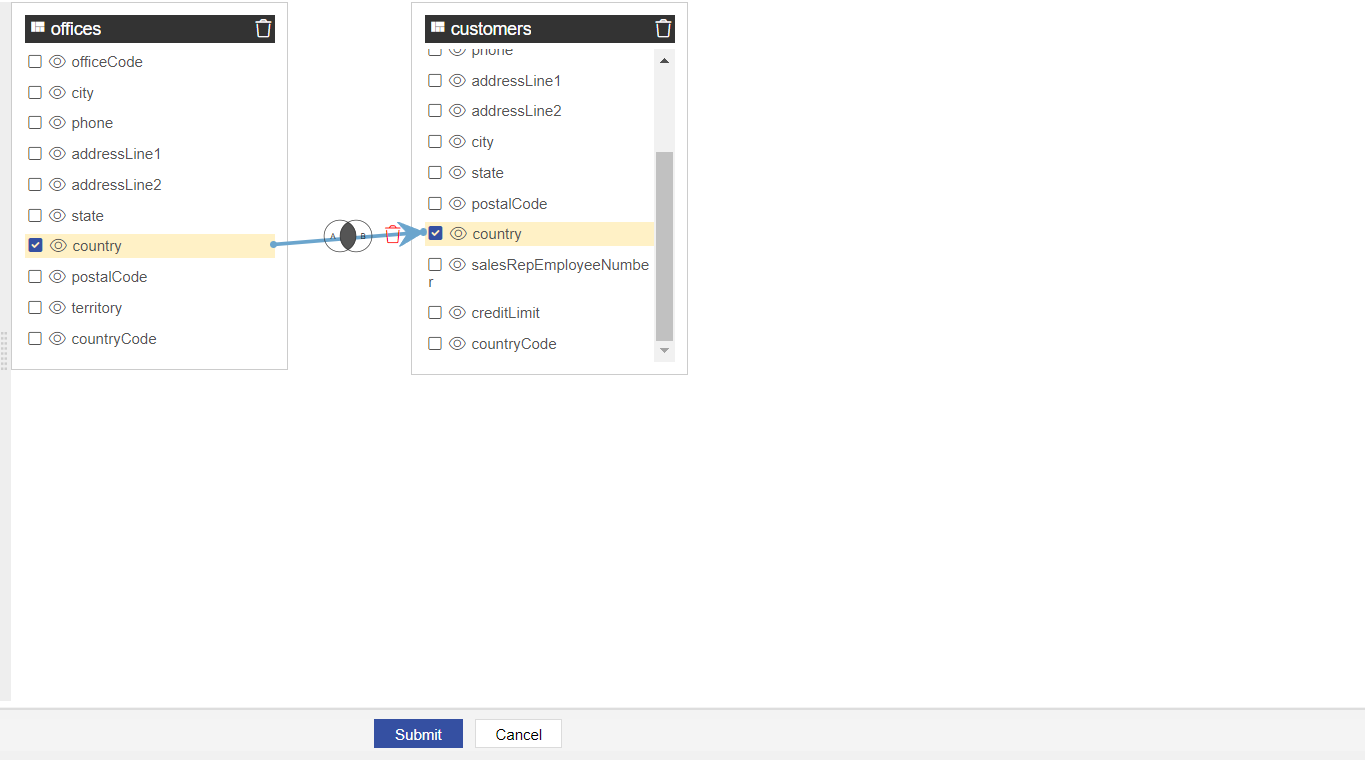
Click on Submit to save the Pipeline.
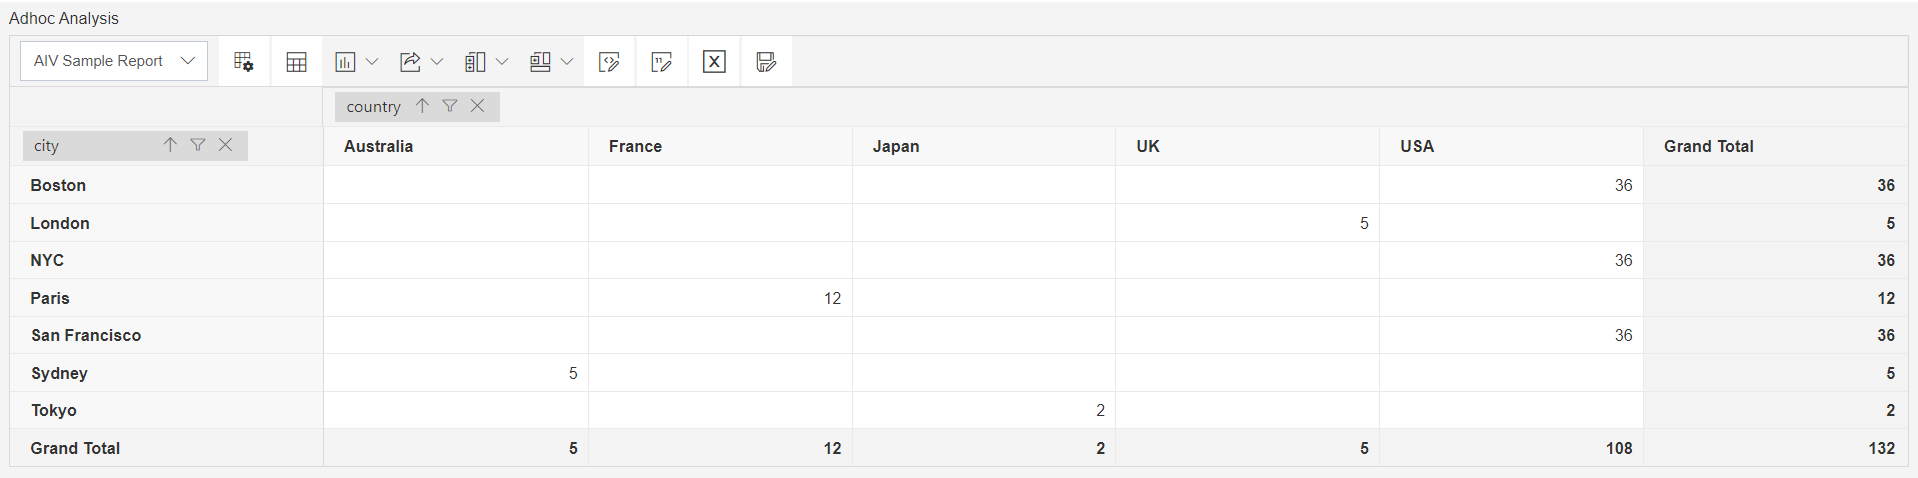
The pipeline is run in the Adhoc Analysis.
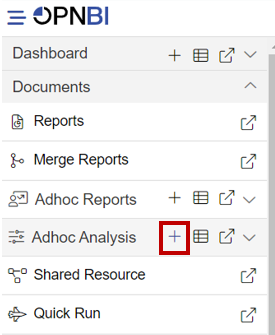
Go to Documents > Adhoc Analysis section from Hamburger menu.
In Adhoc Analysis click on the + icon to create a new Analysis, as shown in the figure below:
When you click on create Analysis then the Analysis Selection dialog box will open, as shown in the figure below:
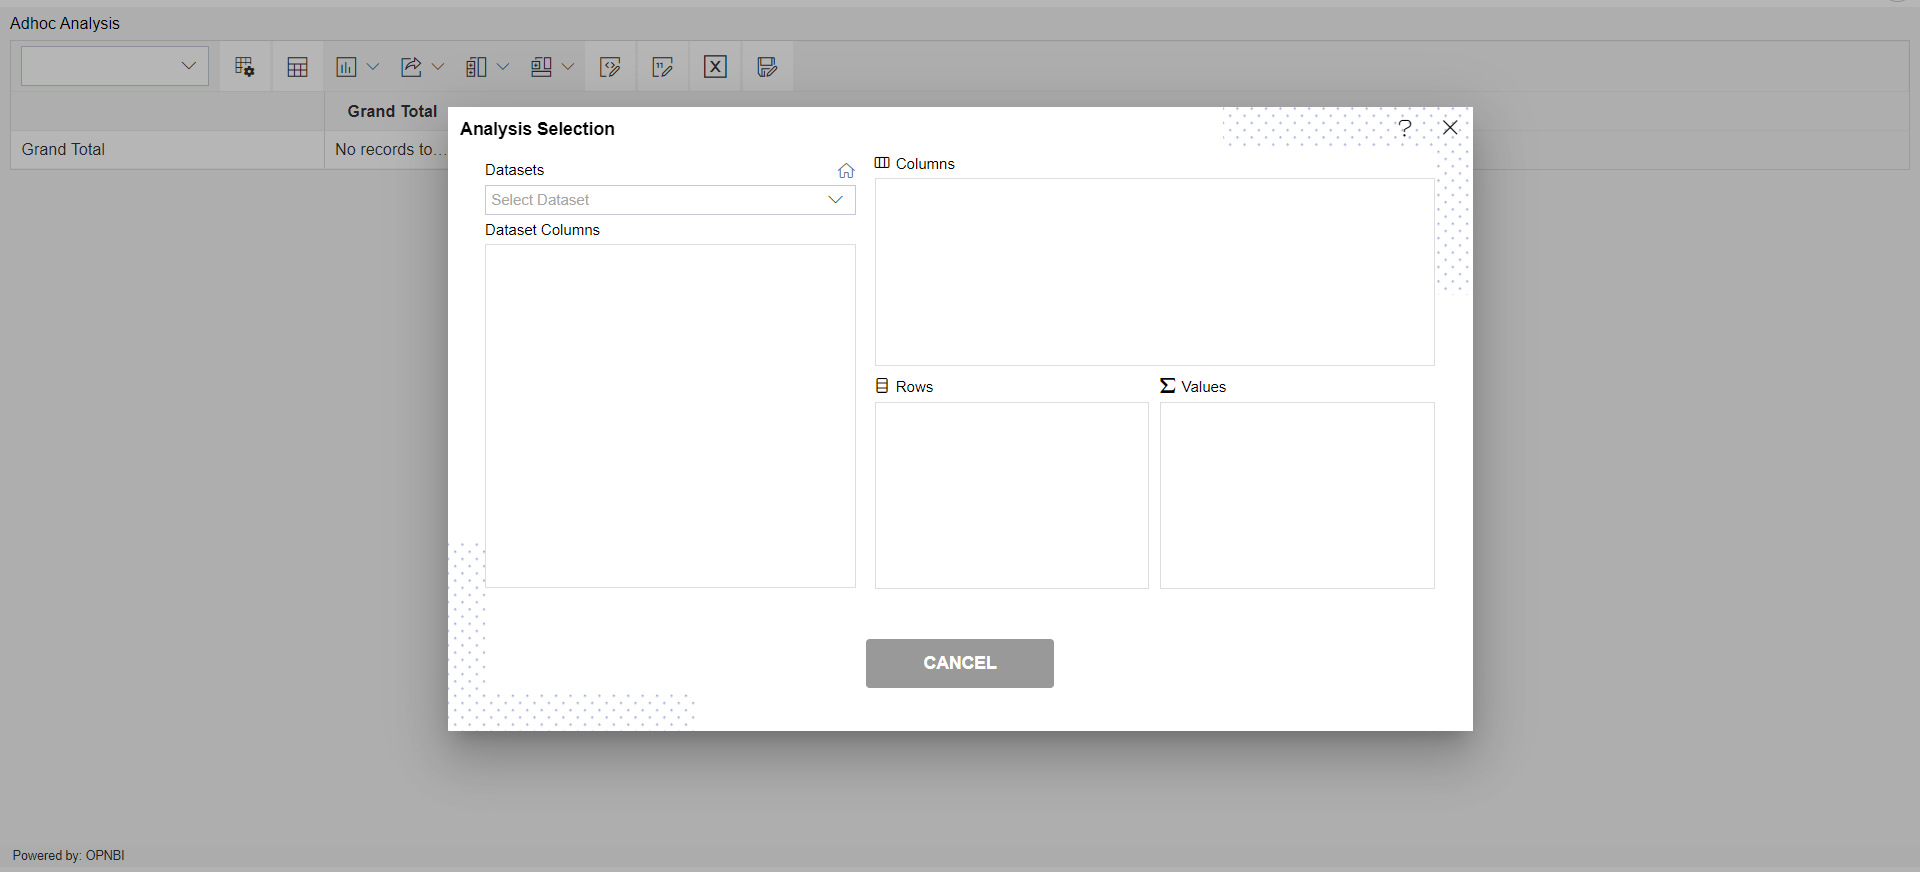
Enter the following details in Analysis Section:
Dataset: Reverse Join (select the Pipeline, which you are created)
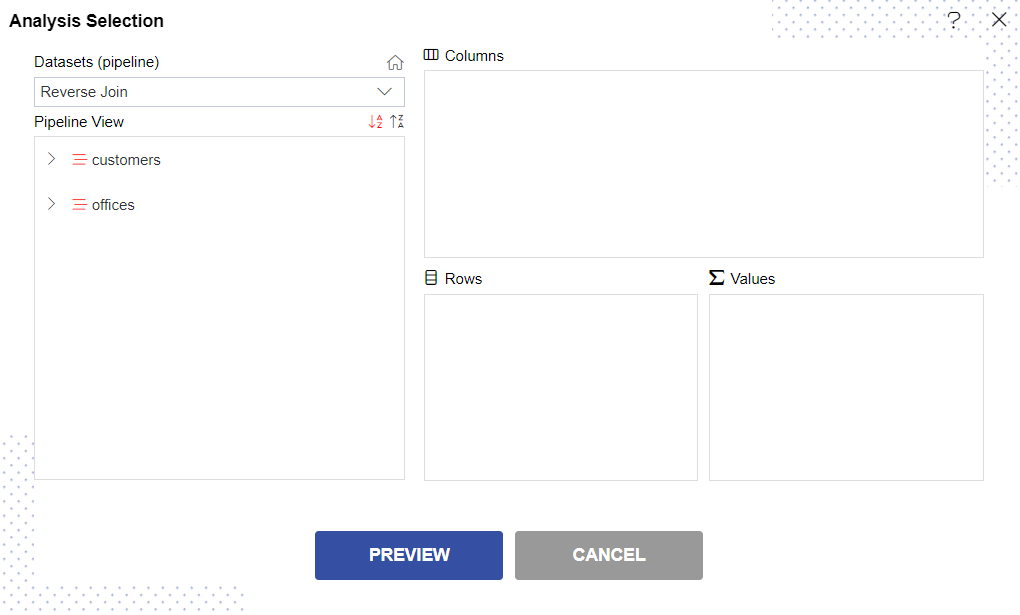
The two tables will get load the left side box of Pipeline view, Now expends the OFFICES table, as shown in the figure below:
Drag and drop CITY column from OFFICES to Rows, Drag and drop a country column from Customer and Put it in Column box, Drag and drop the Postal code column from Customers to Values box (Select count in Type), as shown in the figure below:
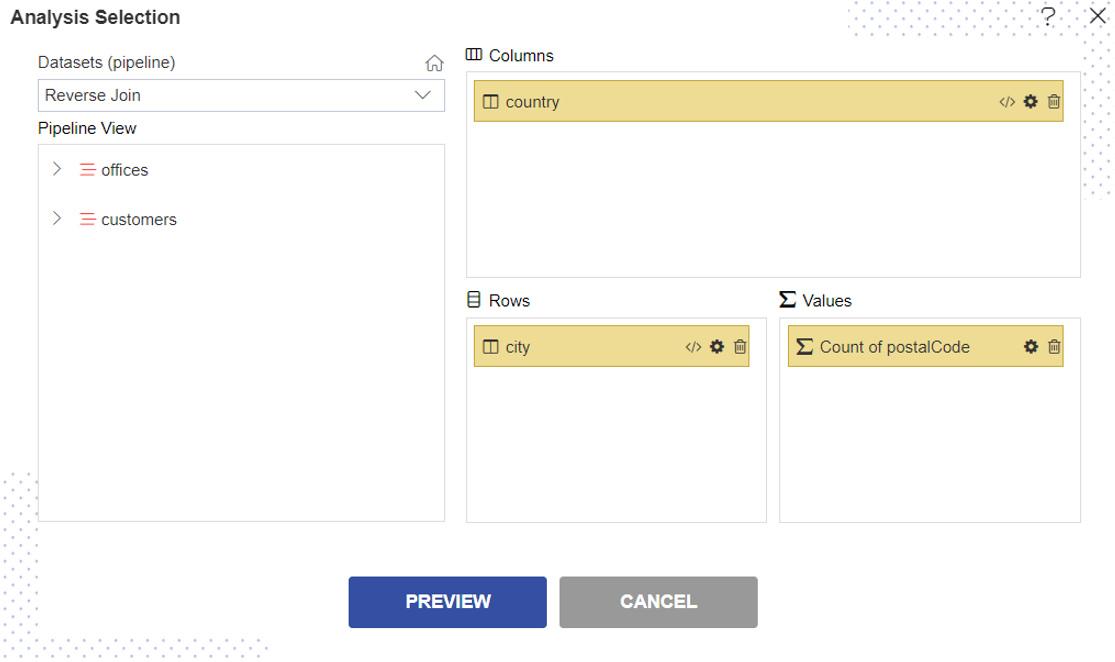
Click on Preview Button it will show the output and after the preview click on Cancel Button it will show the screen as follows:
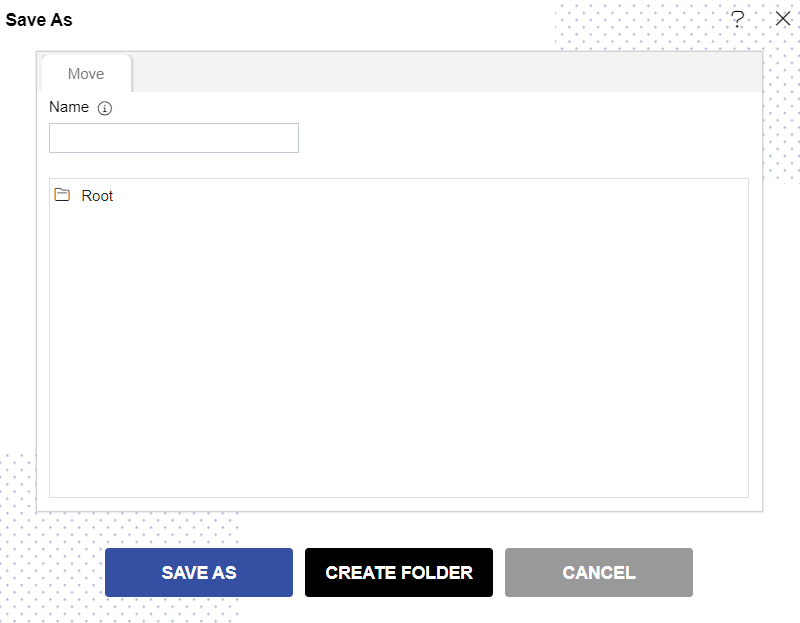
Click on Save as![]() icon for saving the Analysis, it will show the screen as below:
icon for saving the Analysis, it will show the screen as below:
Give the name of Analysis.
Name: Reverse Join Pipeline and Select the folder where you want to save Analysis, as shown in the figure below:
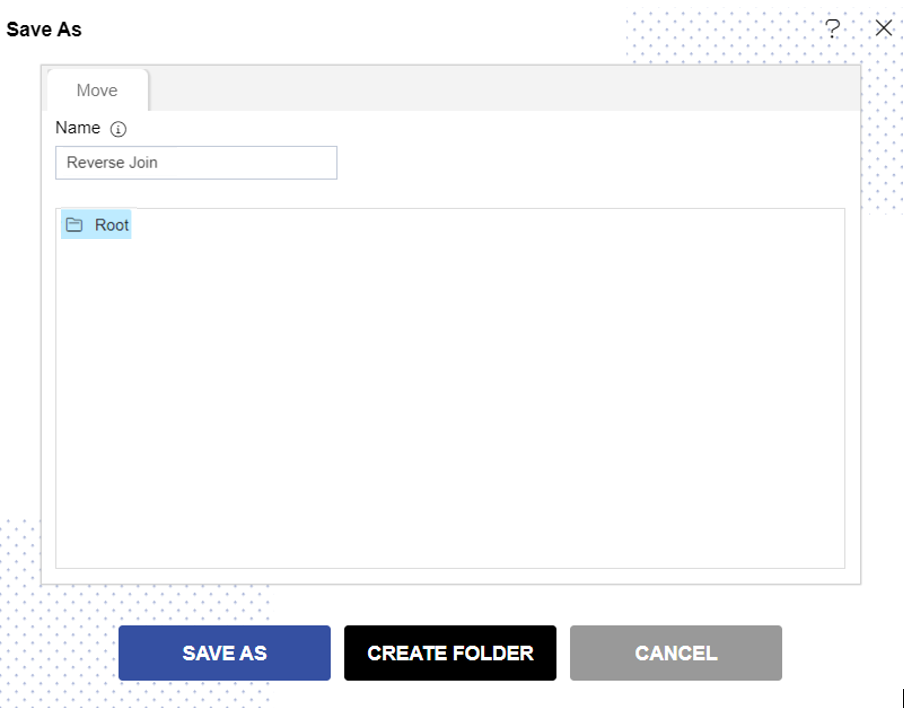
Click on Save As button to save Analysis.