Dynamic Link
- For instance, if a table and chart are linked dynamically, then on the click of any cell in the table, detail of that particular cell will be displayed in the chart.
Objective
- Dynamic Link Widgets & present it in different layers and tabs.
Use Case
- We will create a table about sales of different products, and link it to a chart widget dynamically.
Dynamic Link: This video contains how to use Dynamic Link in OPNBI.
Steps to create Dynamic Link
Follw this link & perofrm given steps in order to create a new dashboard.
Give Dynamic Link name to the dashboard.
From Right Vertical Menu Select the Table Widget icon.
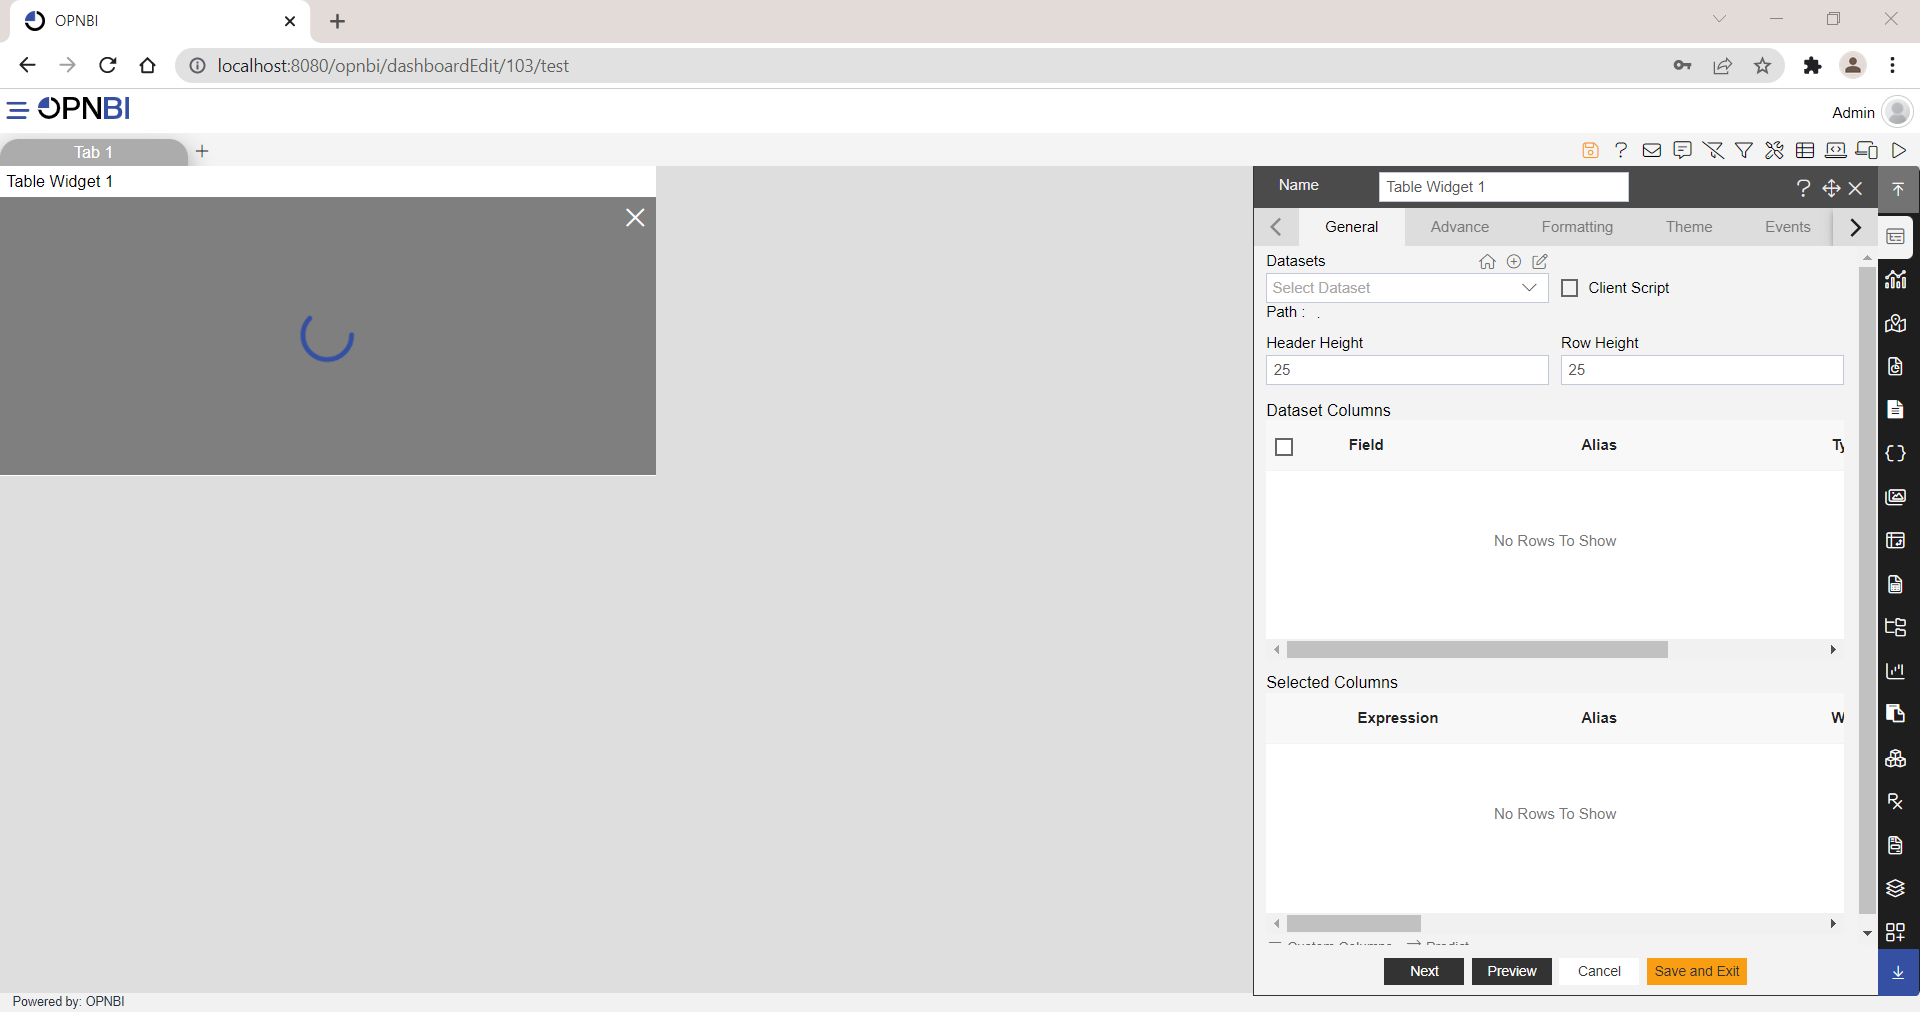
The Edit menu box appears as you click on Table Widget icon. And a widget gets added in content place automatically in dashboard, As shown in figure above:
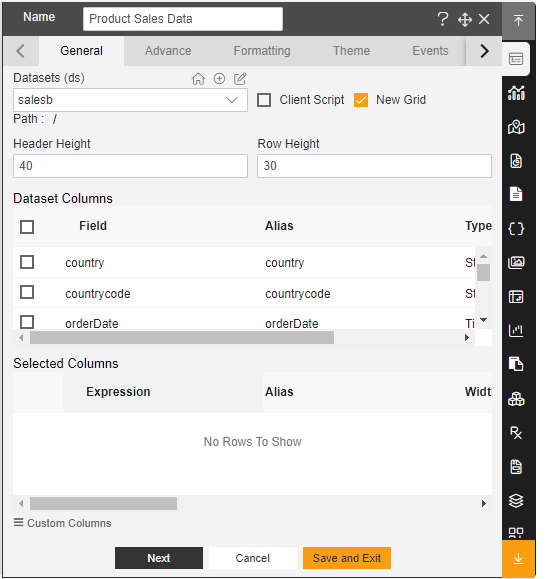
Enter Following details in chart controls:
- Name: Product Sales Data
- Datasets: Sales.cds
- Header Height: 40
- Row Height: 30
- Select all Dataset Columns to the Selected Columns
Fill above details in edit box, As Shown in figure:
Click on Preview and Save and Exit button.
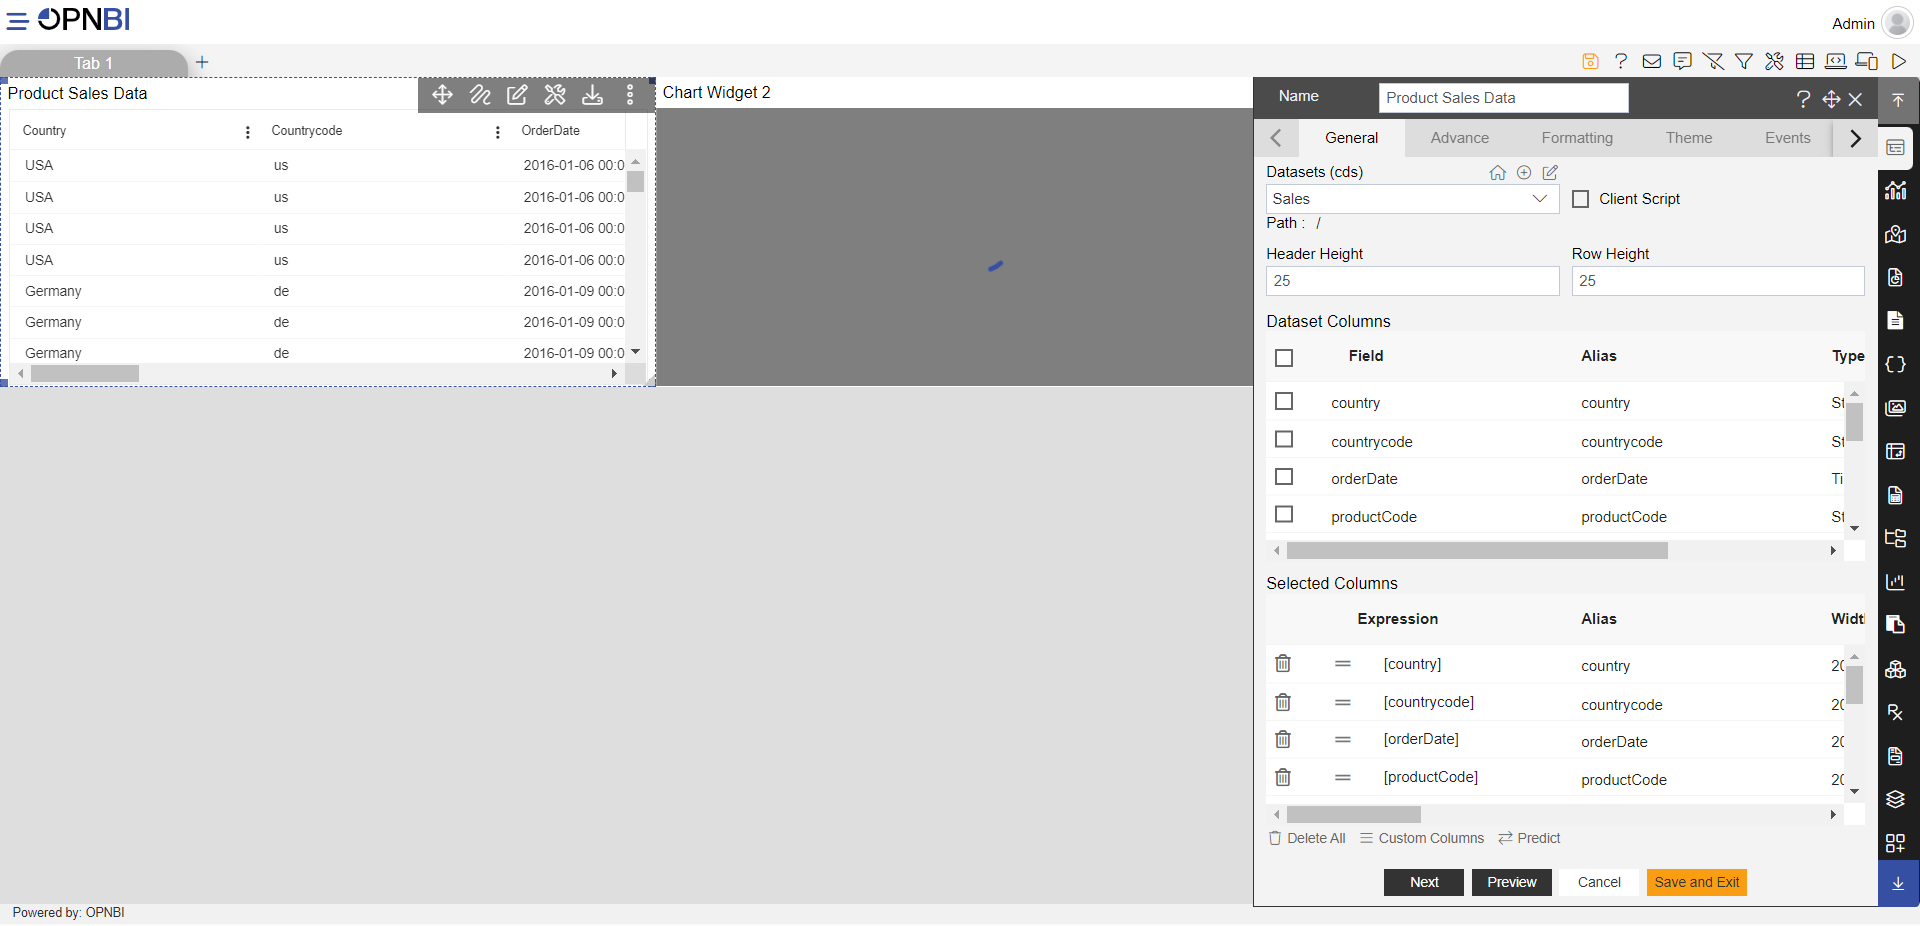
From Right Vertical Menu Select the chart Widget icon.
The Edit menu box appears as you click on Chart Widget icon. And a widget gets added in content place automatically in dashboard.
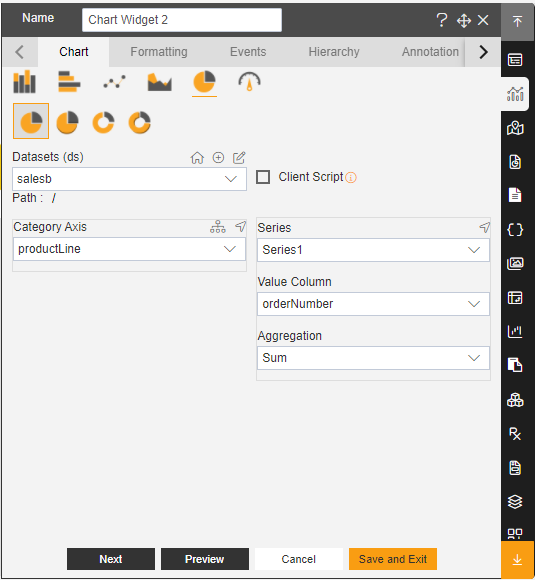
In Chart Widget Select Pie & Donut chart and click on Pie Chart & fill the below details as shown:
- Datasets: Sales.cds
- Category Axis: ProductLine
- Value Column: OrderNumber
- Aggregation: Sum
Fill above details in edit box, As Shown in figure:
Click on Preview and Save and Exit button.
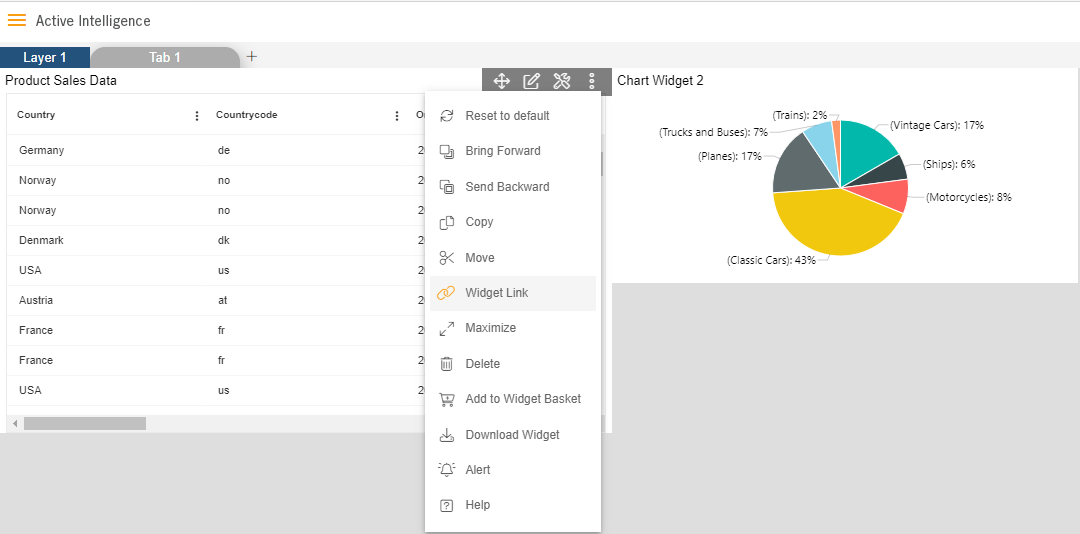
Click on the side ellipsis in your table widget and Select Widget Link As shown in Figure Below:
Enter Following details in Widget Link:
- Linked Column: ProductLine
- Layer: Layer1
- Tab: Tab1
- Chart Widget 2 - Column Drop-Down: ProductLine
Fill above details in edit box, As Shown in figure below:
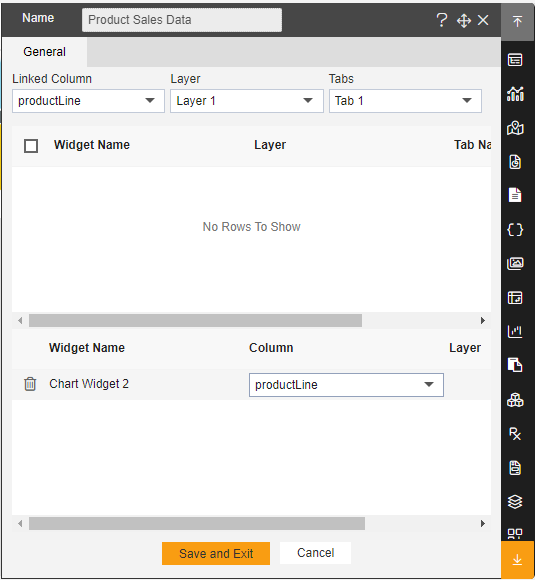
Click on Save and Exit button.
Now, match your Dynamic Link with the below example, it should look like the figure below:
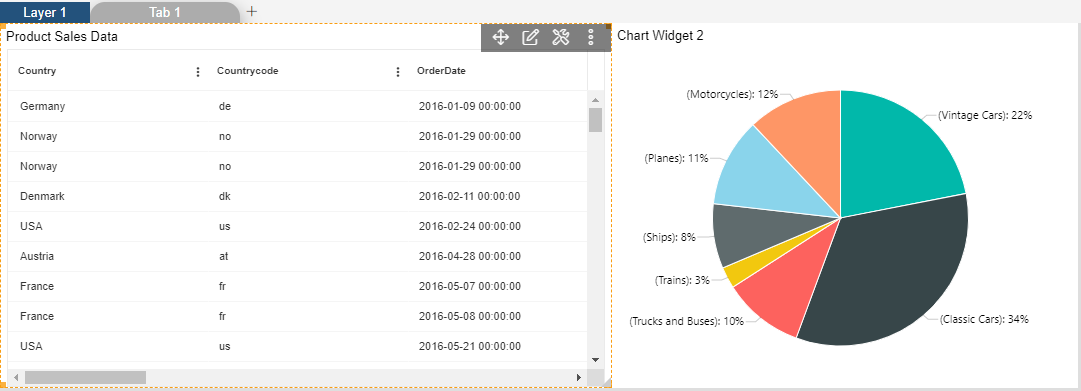
In this manner, the user can dynamically link widgets to obtain specialized data.
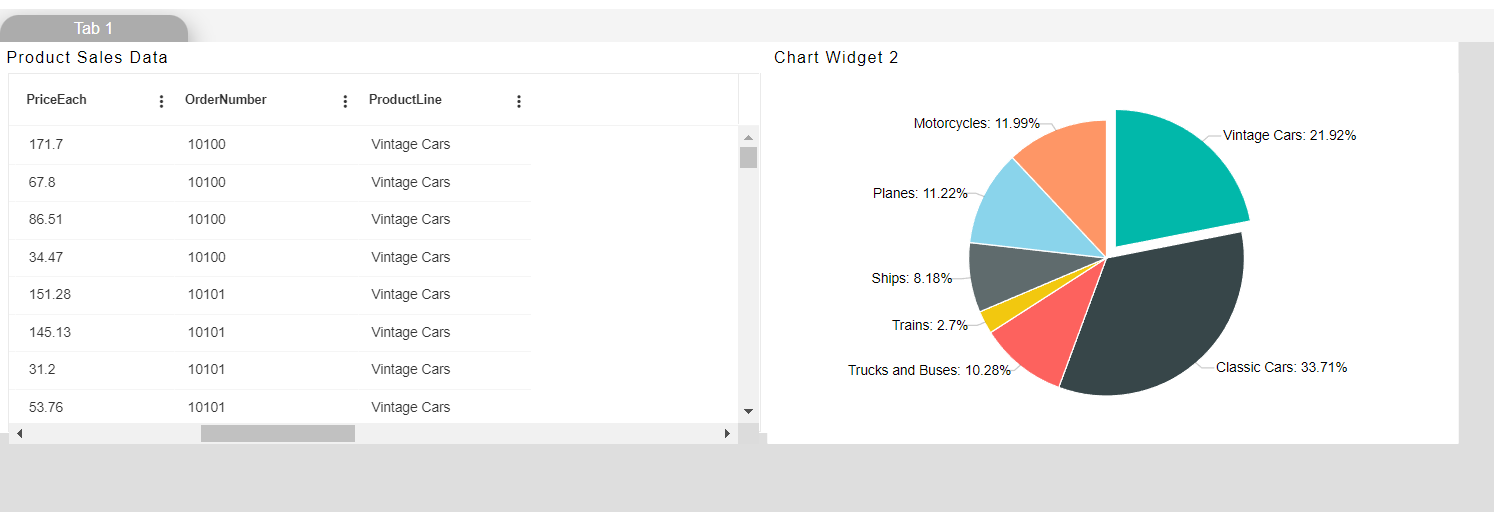
Now as we click on the slice name Vintage Cars of the pie chart, it will show the data of Vintage Cars in the Product Sales Data Table.
Widgets can be linked across multiple layers also which will be discussed in the Dashboard Layers, Views & Tab section of the Documents.