Gauge Chart - Minor Ticks G :-
Gauge Chart - Minor Ticks: This video contains how to format Gauge Chart - Minor Ticks in OPNBI.
- This document is all about how to use the Minor Ticks feature of the Gauge chart in OPNBI. By using this feature, the user can make changes in the Minor Ticks appearance of the Gauge chart.
- Go to the Edit menu of the chart > Formatting tab > Minor Ticks
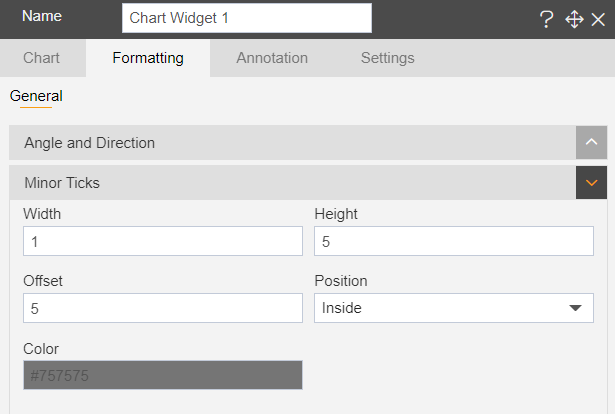
Width: By this user can make changes in the thickness of minor ticks of the chart.
Height: Used to make changes in the height of the minor ticks of the chart.
Offset: By using this user can set the distance of the minor ticks from the circle.
Position: It has two options in the drop-down: - Inside & Outside. Used to set the position of the minor ticks inside or outside of the circle as required.
Color: Used to set the color of the minor ticks. Users can select any of the colors from the palette.
When the user selects Inside from the drop-down of the Position feature, the chart will look as per below:

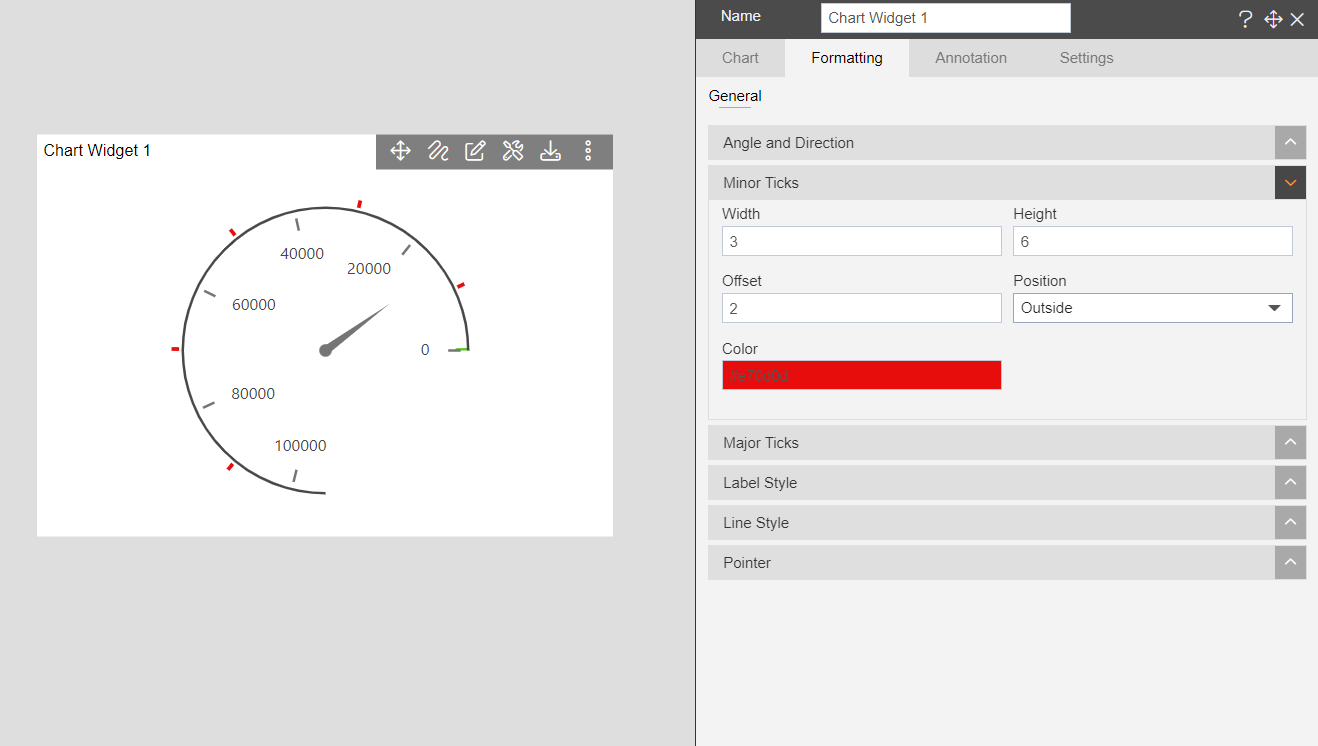
When the user selects Outside from the drop-down of the Position feature, the chart will look as per below:
To know more about other formatting properties click on below links:-