Formatting Property of Funnel Chart
Formatting Settings Menu:-
- The Formatting properties are used to control and apply all the information appearance in Funnel Chart through the categories of General, Series, Legend properties, Category and Value Axis.
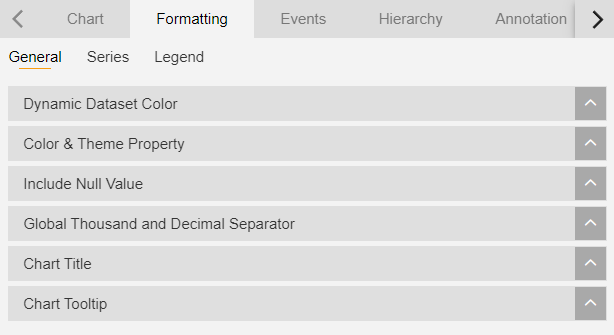
General Properties:-
The General settings used to add Color and Theme changes as user required, Chart title, Chart information tooltip settings are used to control by the general.
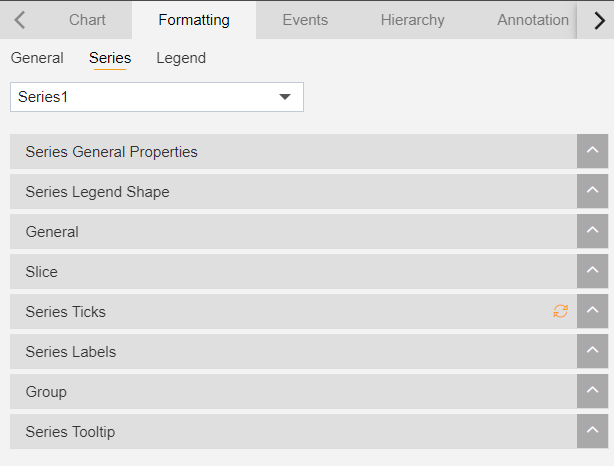
Series Properties:-
- Series Properties are used to apply the pie chart series settings like slice appearance, tick’s appearance, labels, grouping of series, customized tooltips, dynamic labels.
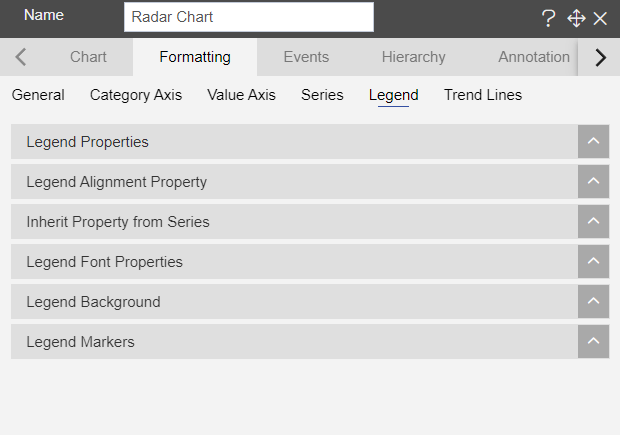
Legend Properties:-
Legends’s properties are used to add legends to the pie chart and apply user required appearance settings to legends.
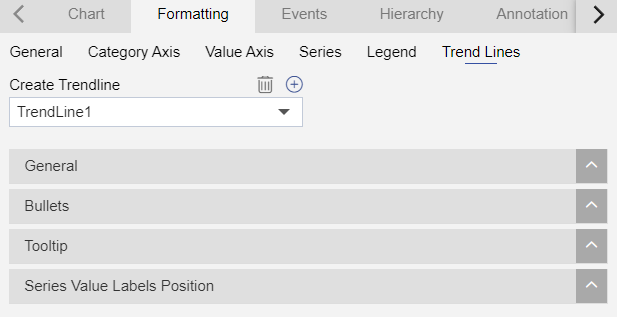
Trend Line:-
Trend Line
To know more about other formatting properties of Radar Chart click on below links:-
1. General Properties
2. Series Properties
3. Legend Properties
In order to understand in detail about Funnel Chart, click on the following links:-