Min and Max Value Property
Min and Max Value Property: This video contains how to use Min and Max Value Property of Chart in OPNBI.
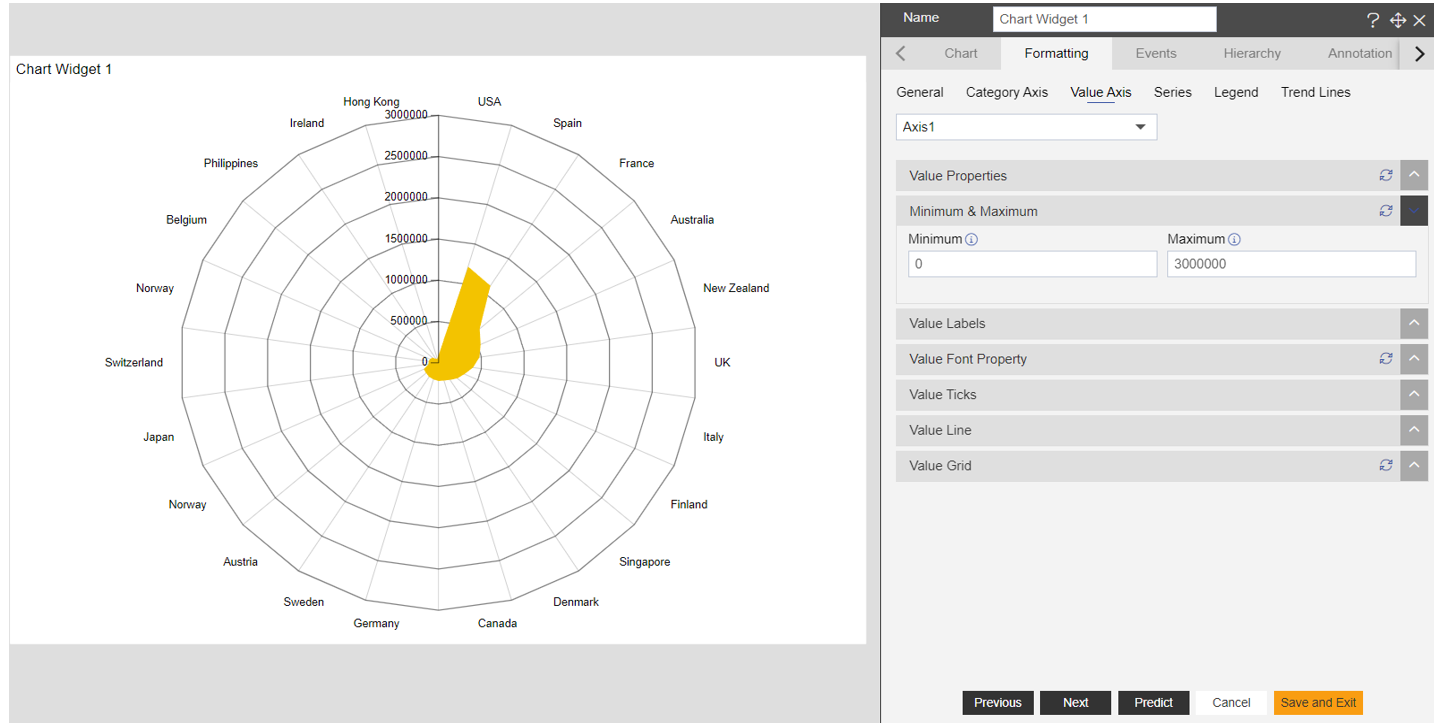
- Radar chart > Min and Max Value Property.
- Minimum & Maximum – used to keep value Axis data from minimum value to maximum value in the chart.
Go to Edit Menu > Formatting tab > Value Axis > Minimum & Maximum

By default, they both are empty.
User can insert the Minimum & Maximum Value as per their requirements.
To know more about other Value Axis property click on below links:-