Cascade Filters
Introduction
This document explains how to create cascading filters and what is the use of creating a filter in cascade mode.
Objective
The objective of this document is to guide the user to create and get hands-on with cascade filters.
Prerequisites
The user will require the following dataset to understand this filter scenario;
- sales.cds dataset
Download above file by clicking here. extract this file and upload the dataset in the dataset section using drag and drop.
Use case
The filter is used to filter dashboard data as per user input. Users can add as many filters as they want in the dashboard to get the required filtered data. so what is the difference between normal filters and cascade filters? let's understand this in one scenario,
There is a dashboard that shows data by country, year, and type of product. The user wants to filter this data by country, year, and product type so he created 3 different filters. but scenario may arise where a country let's say the USA does not have any data in the year 2017 for example and the user provides the USA in-the country filter and 2017 in year filter and click on the filter button. But the USA does not have any data for the year 2017 so the dashboard will be empty i.e. no data will be displayed. This happens as an end-user does not know there is no data of the USA for 2017 so 2017 should not be in the list if the user selects the USA in the country filter. this is what cascading is.
we should make the year filter dependent on the country filter and product type filter on the year filter. what will happen if we do so is when the user selects a country from the country filter, based on the value of the country filter list of values the year filter is updated and it will show you the value which is there for the selected country only.
The same thing applies to the product type filter, based on the selected value of the year filter, a list of products is filtered. This way there will not be a scenario where nonrelevant options will be displayed in the filter list.
Steps to follow
Please follow these steps to cascade filter and understand its function;
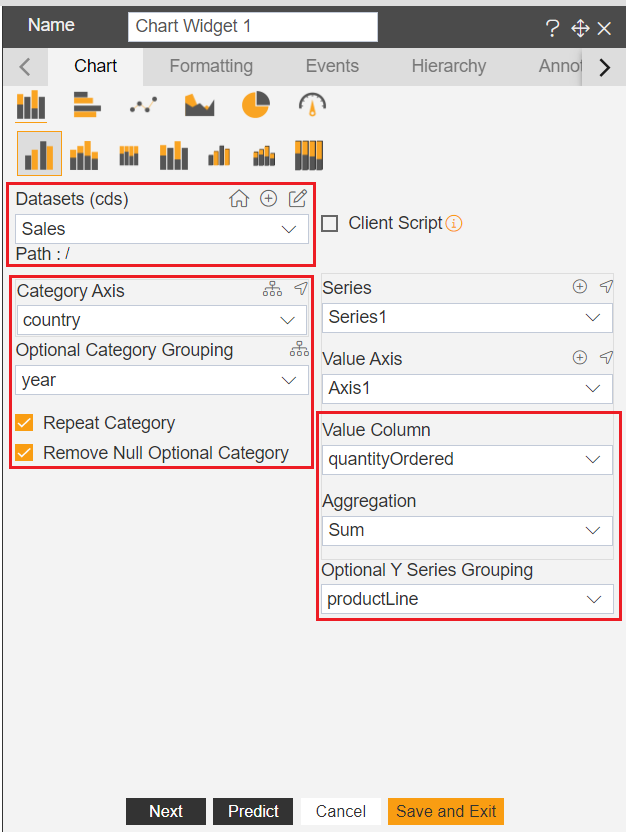
Create a new dashboard and add a new column chart to the dashboard. in the chart widget please provide the following properties.
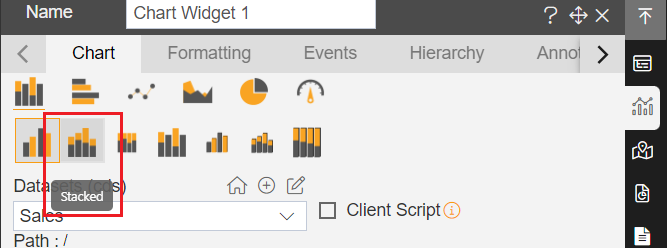
From the list of charts, click on the stack chart option & Click on save and exit to save the changes.
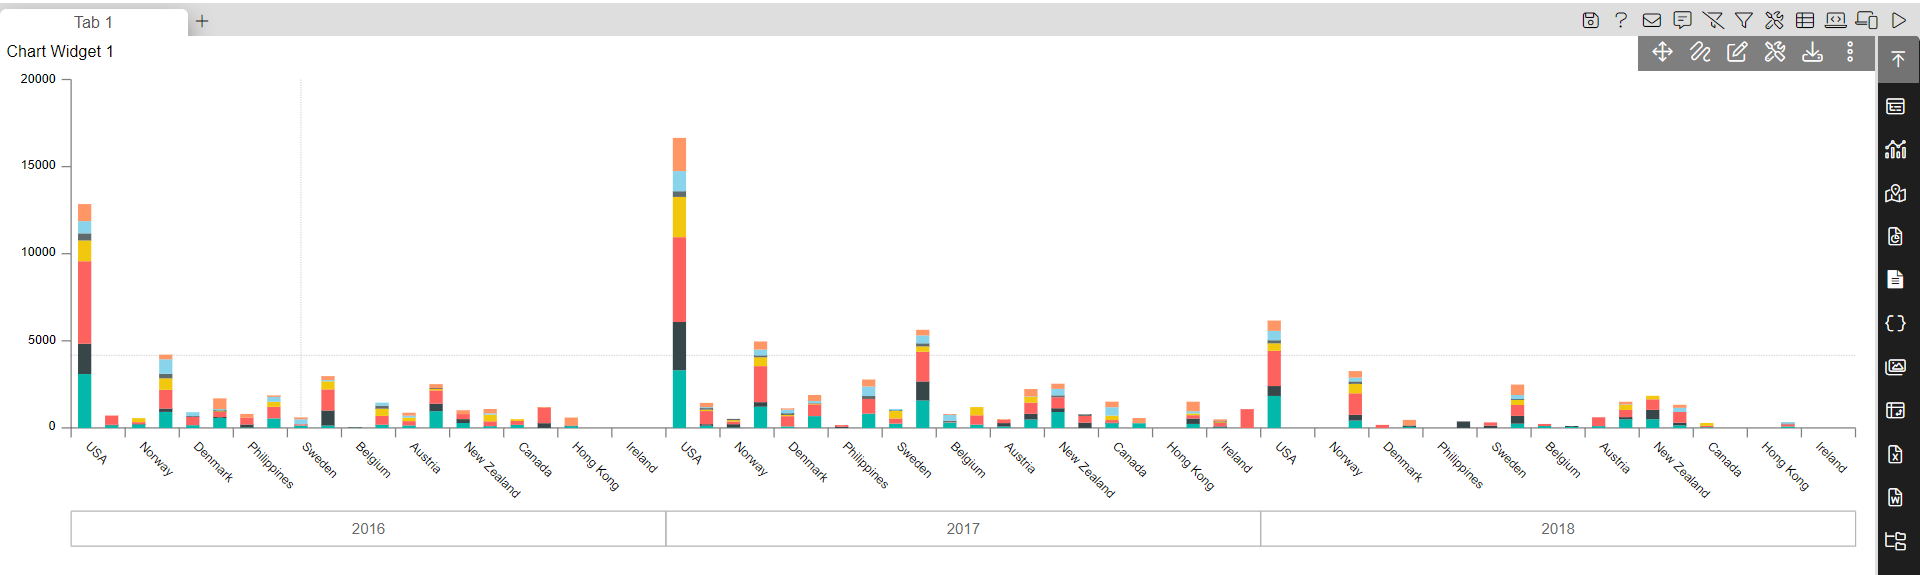
Resize the chart widget and you will see a widget formed like the below image,
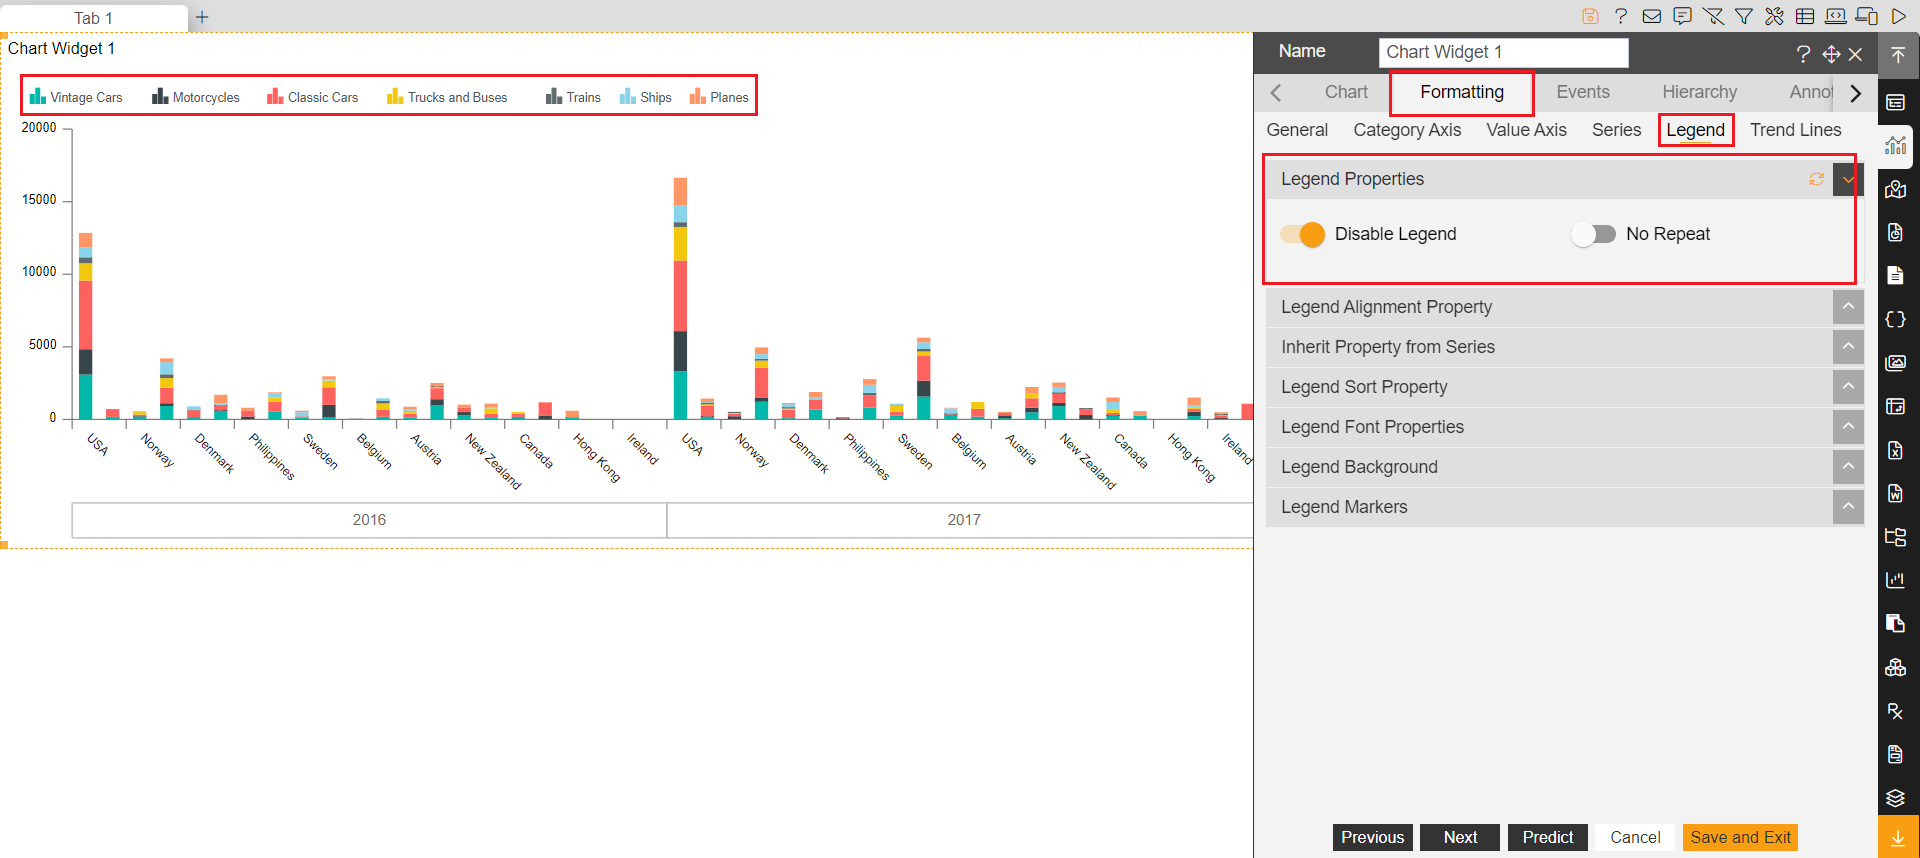
To identify stacked values, enable legend from the widget edit properties.
Edit the chart widget and go to the Formatting tab, click on sub-tab Legend and expand Legend Properties.
From the legend properties, enable legend by toggling the slider button. you will see legends are added in the chart widget.
Click on save and exit to save the changes.
Now let's create cascade filters in this dashboard. Click on the filter icon from the dashboard icons and create a filter named country. Click on the setting icon to configure this filter.
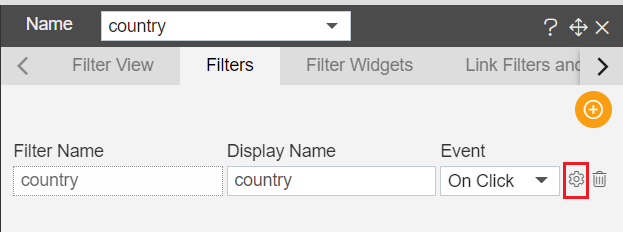
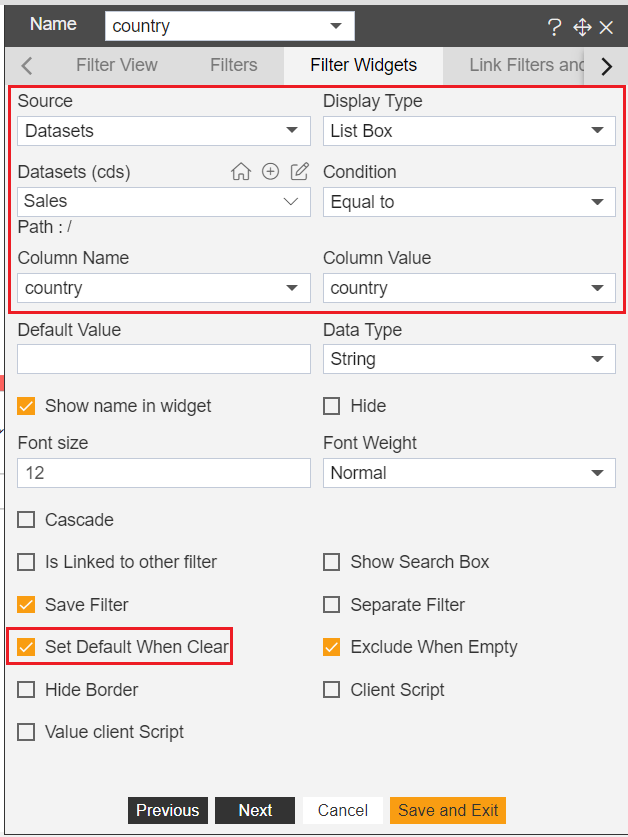
Provide filter properties as below;
Source: Dataset
Display Type: List Box
Datasets: Sales.cds
Condition: Equal to
Column Name: country
Column Value: country
Set Default When Clear: Checked
Click on save and exit to save the changes. now link this filter with the chart widget created. Click on the filter icon and click on the setting icon to go to the configuration tab. Click on the Link Filters and Widgets tab to link filter with the widget.
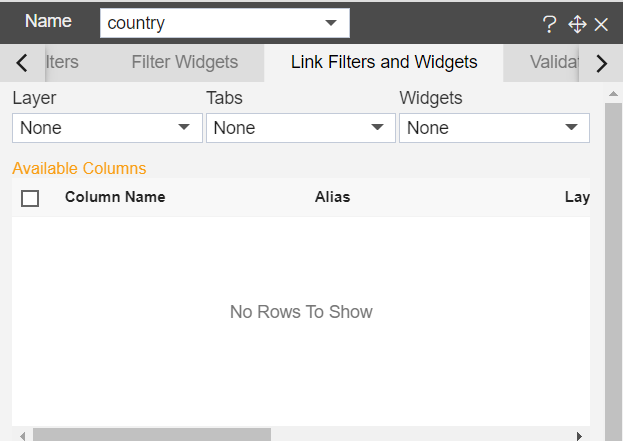
Apply the following properties in the Link Filters and Widgets tab;
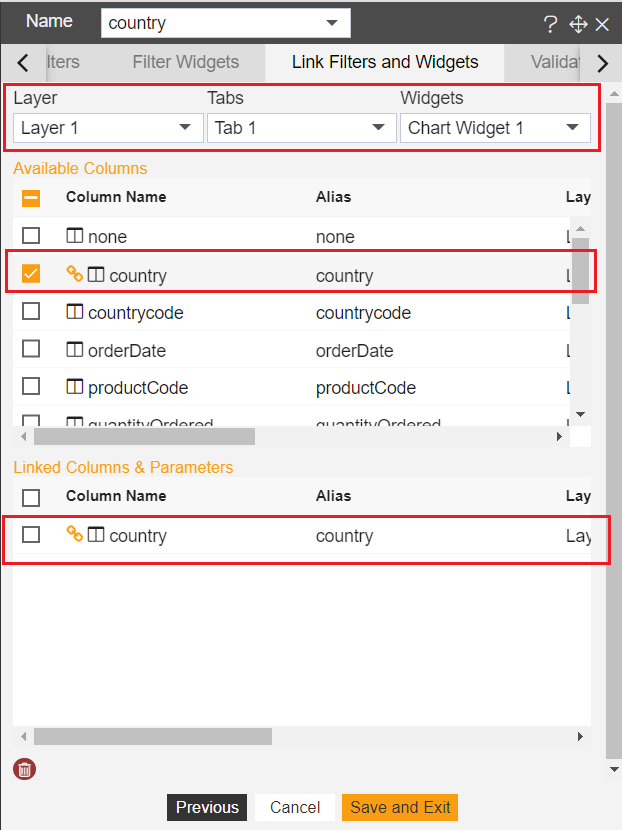
Click on save and exit to save these changes
Create a second filter named year and provide the following properties;
Source: Dataset
Display Type: List Box
Datasets: Sales.cds
Condition: Equal to
Column Name: year
Column Value: year
Set Default When Clear: Checked

The next step is to make the year filter dependent on the country filter. you can see a checkbox named cascadethe on the same screen. Click on this checkbox to enable cascade options for this filter. once you click on this checkbox you will see the following options;
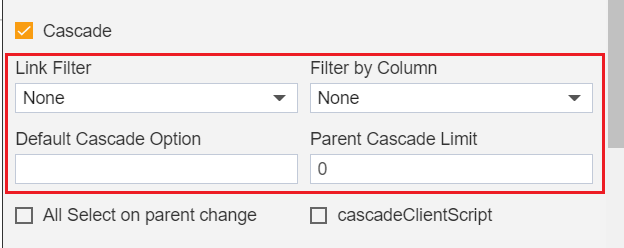
There are 4 options visible once we enable the cascade checkbox;
Link Filter: Select the filter on which this filter would be dependent. A list of created filters will be displayed here.
Filter by Column: select the column by which this filter value will be filtered. here list of columns of filter selected in Link Filter will be displayed. the column you select here will filter dependent filter values. in this case, year values will be filtered by the country value of the country filter.
Default Cascade Option: Provide a default value if you want to display any value to be selected by default when hen dashboard is loaded. but make sure the default option should be applied as per the default value of the parent filter otherwise it will not work.
Parent Cascade Limit: ADD FUNCTION HERE
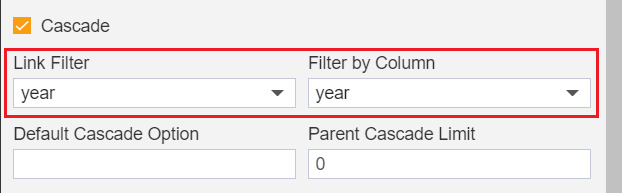
Select filter values as in the below image,
Click on save and exit to save the changes.
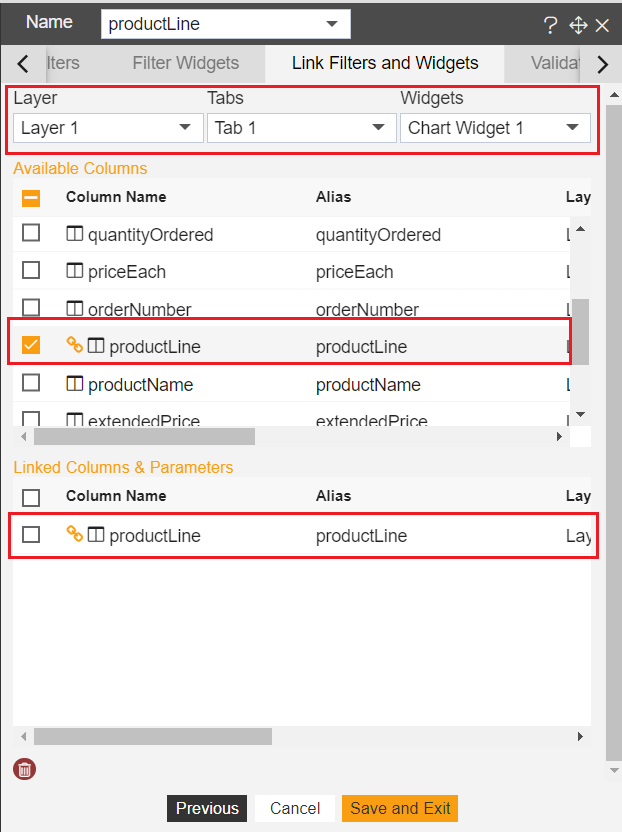
Create a product type filter, click on the filter icon from the dashboard icons and add a new filter productLine. Click on the setting icon to go to filter configuration.

Go to the Link Filters and Widgets tab and select properties as shown in the below image and select the column productLine to link filter with the productLine column.
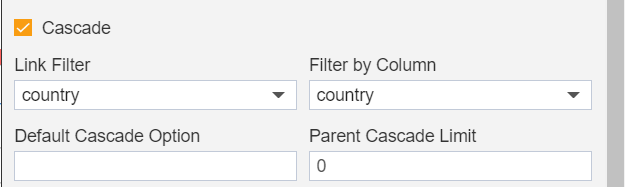
Again go to the previous tab Filter Widgets and click on the cascade checkbox. provide details as per below screenshot,
Click on save and exit to save the changes
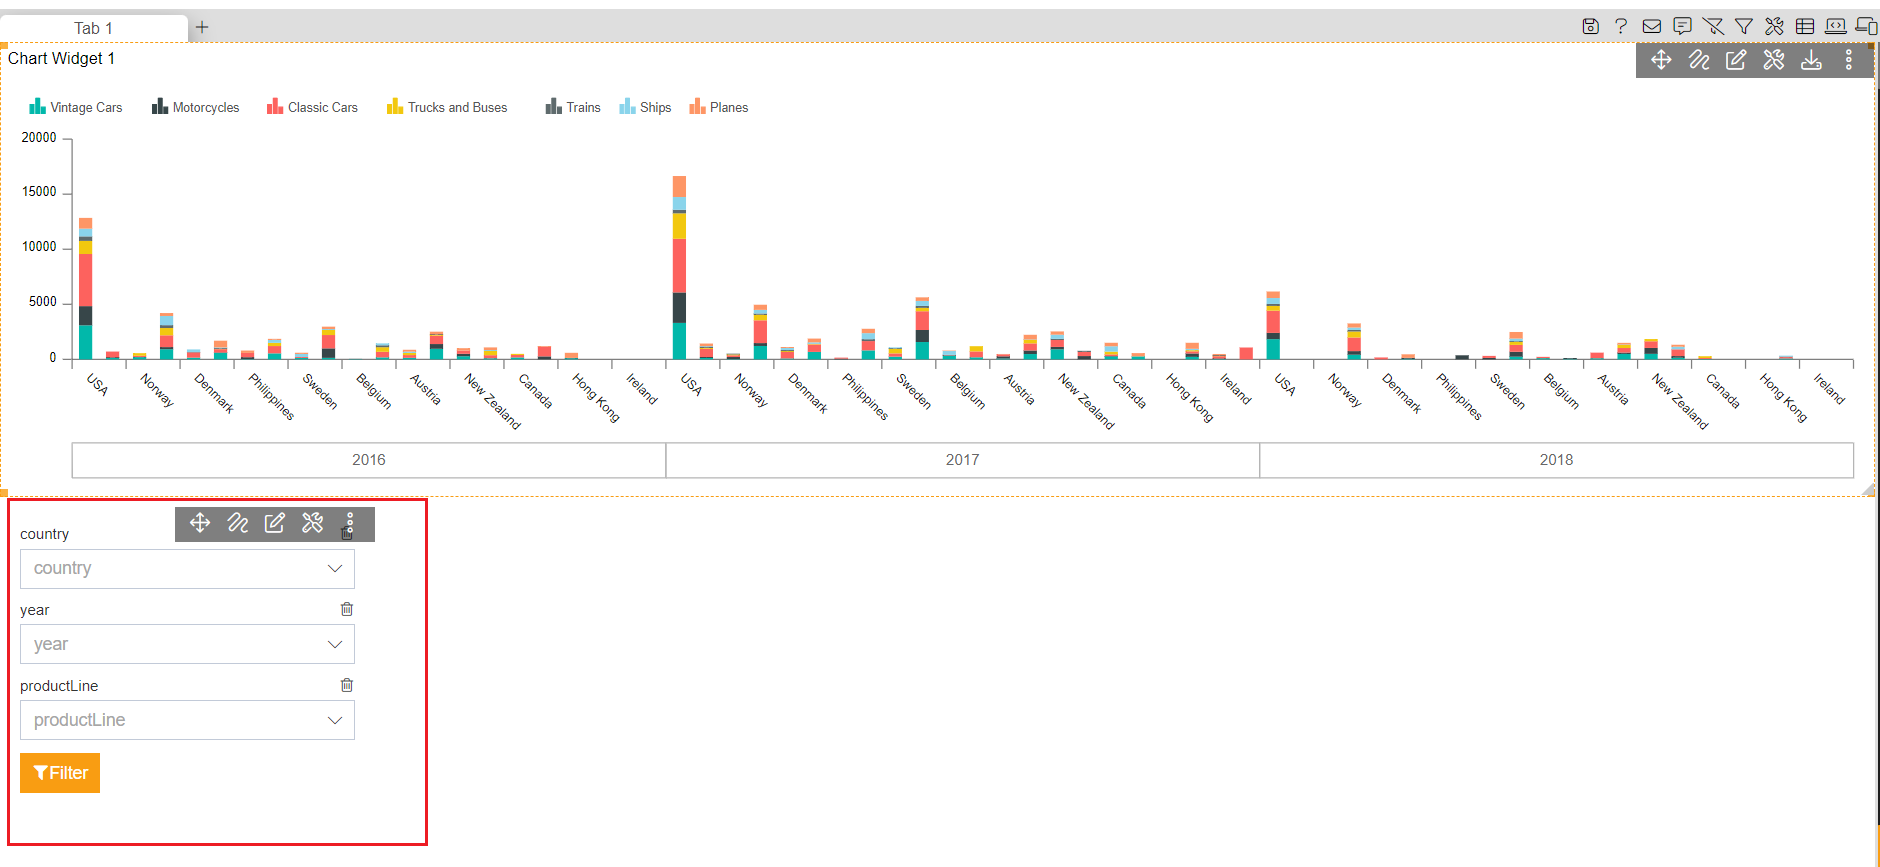
We have created all 3 filters and now add these filters to the dashboard. Click on the filter icon from dashboard icons and with to the Filter View tab. Click on the + icon of the country, year, and productLine filter in a sequence to add filters to the dashboard.
Click on save and exit to save the changes. you can see all 3 filters are added to the dashboard.
Go to dashboard preview mode by clicking on a preview button.
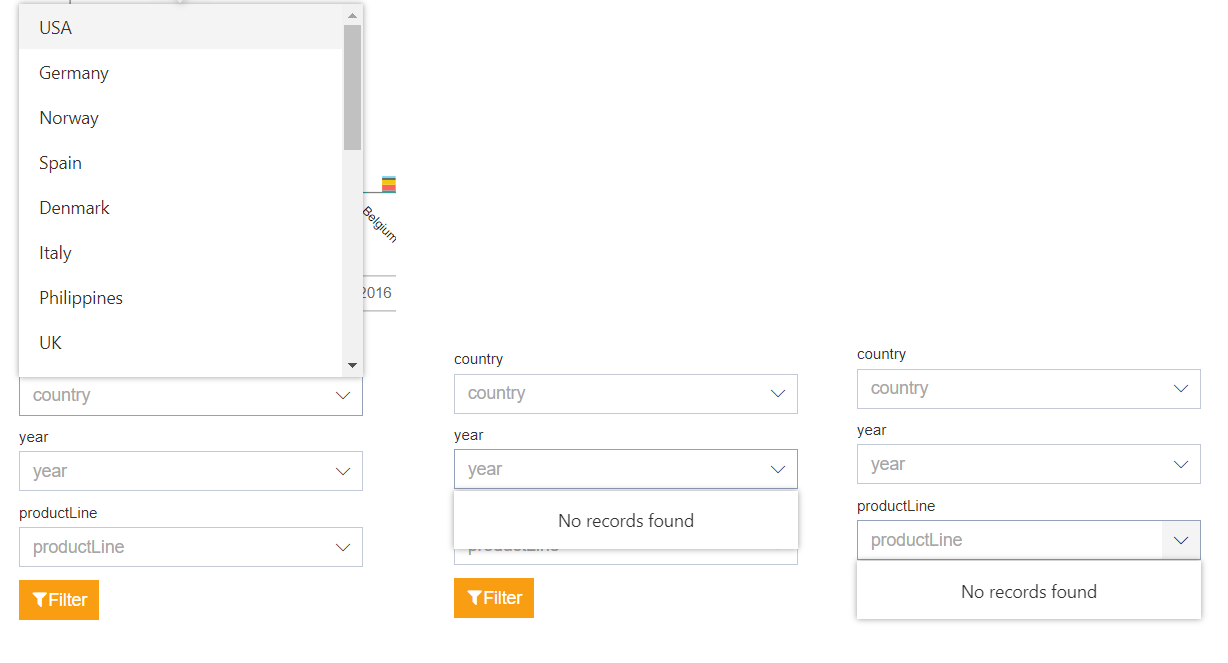
In preview mode, click on country filter, it will show you the data. Now click on the year filter and you will see there is no data to display because we have not selected any data in the parent filter country.
Same way if you try to open productLine, there should not be any list of data as there is nothing selected in the year filter.
Select a country for example USA in the first filter and open the year filter. now you can see a list of the years available in the filter dropdown. select any year and open the productLine filter. you will find a list of products for the year selected.
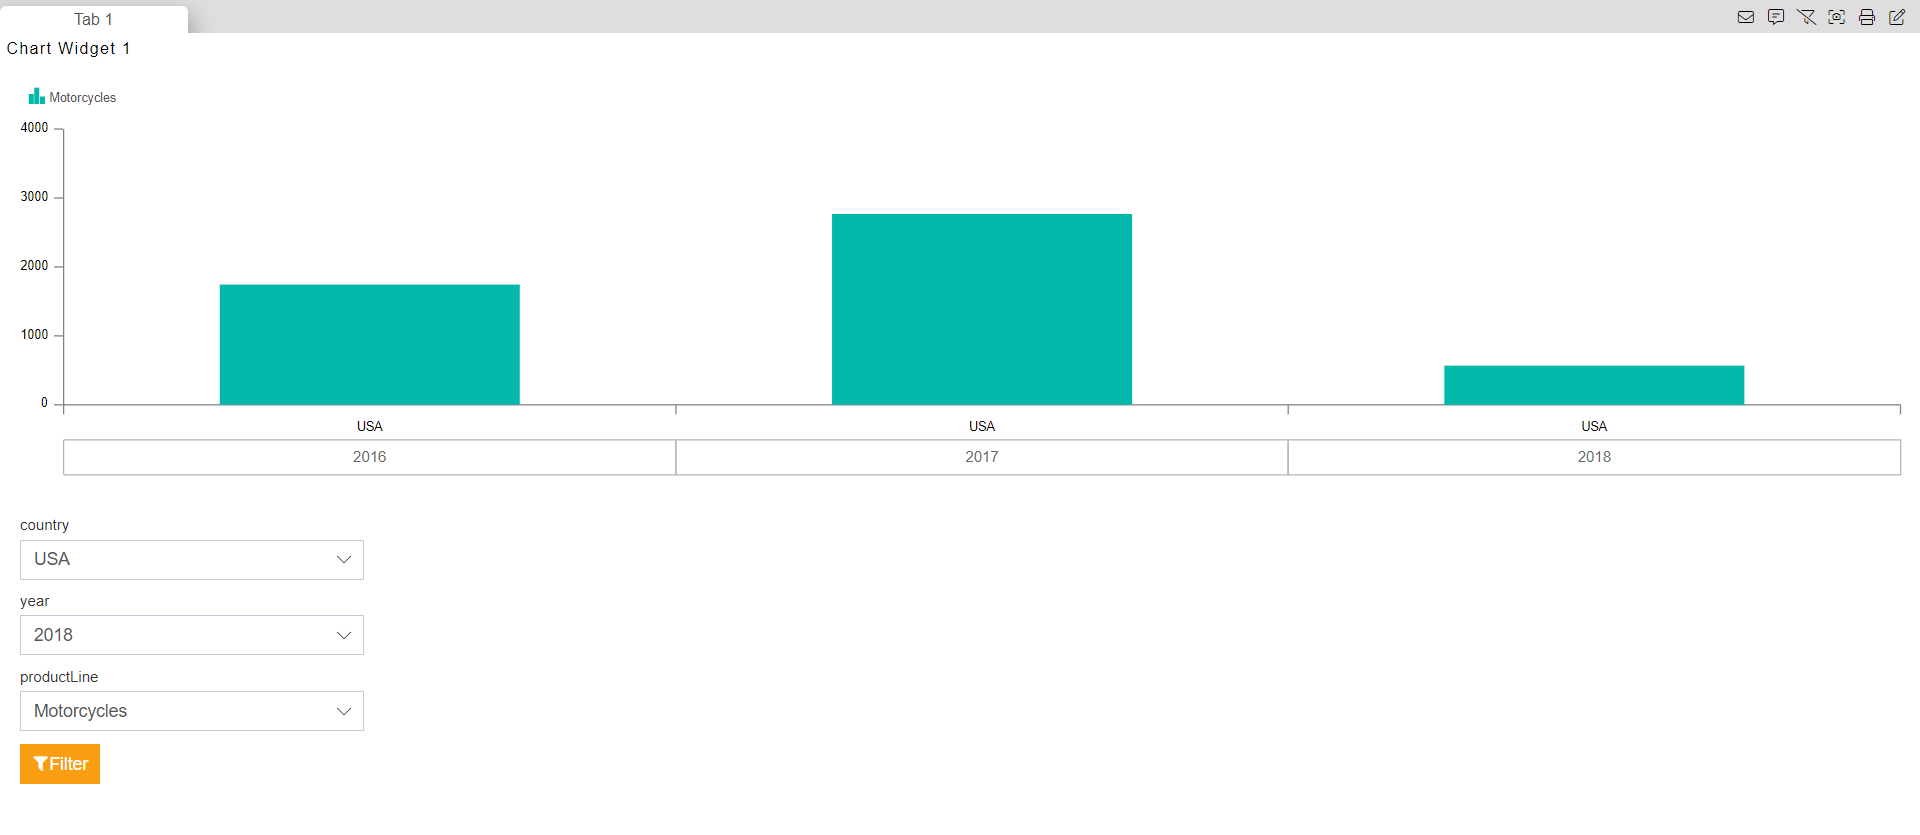
Click on the filter button and see the widget is filtered with the selected data
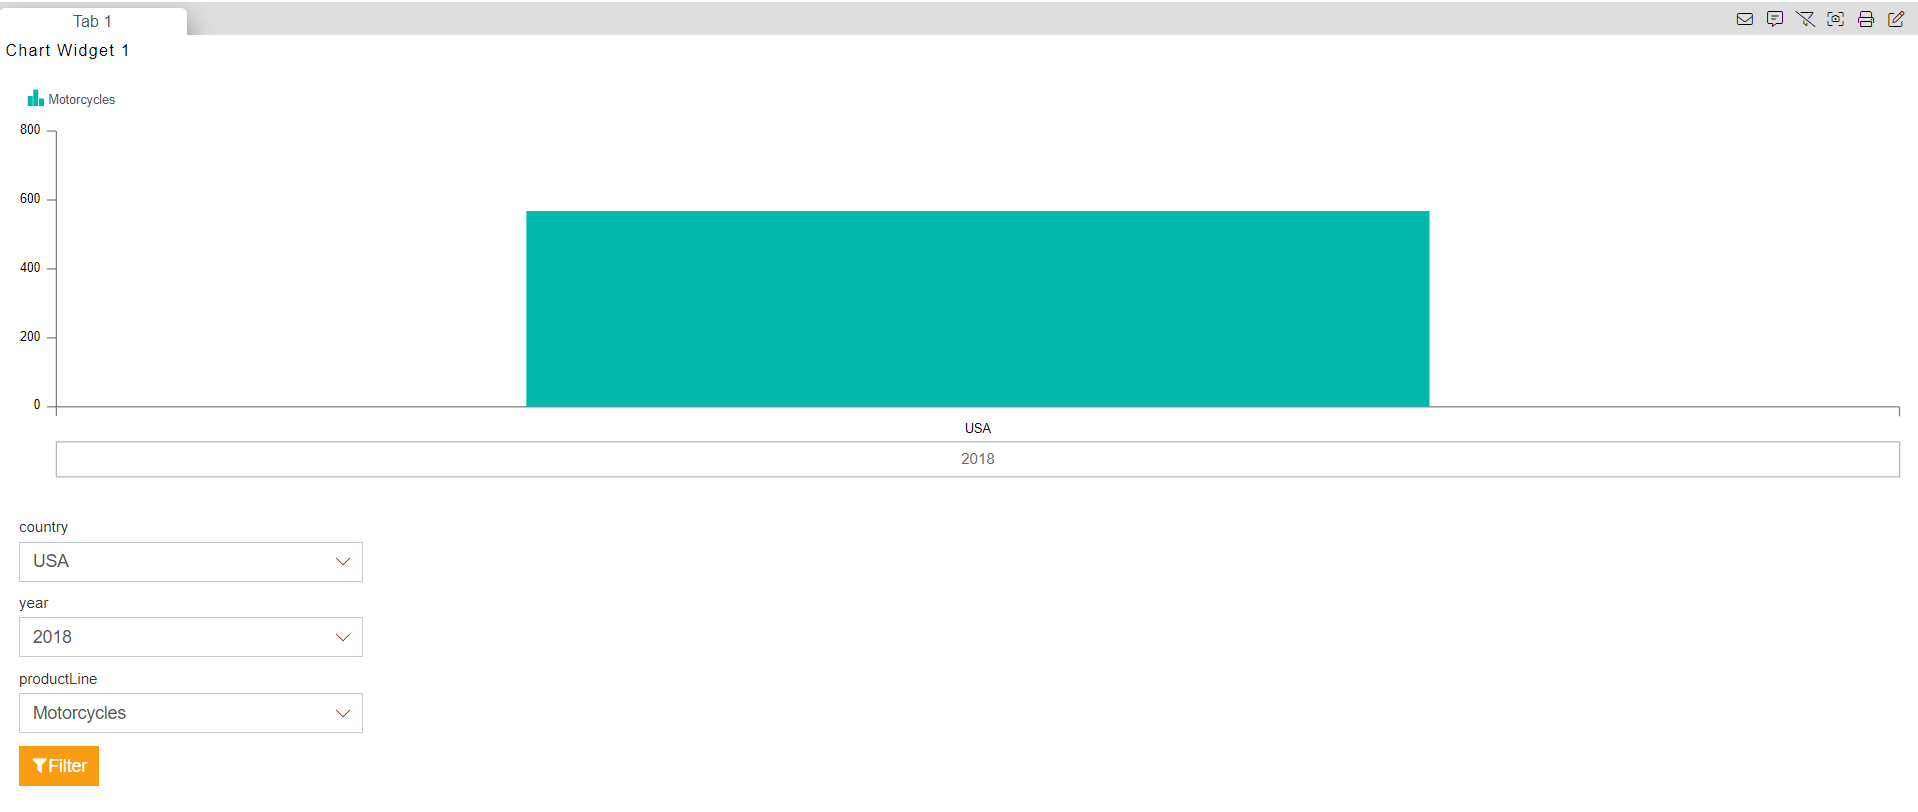
Likewise try to change the country value and see if child filter data is changing accordingly.