Create Card Widget
- A KPI card can be used to compare values using a formula. It can be either two completely different values or the same value at two different times. A KPI card allows you to measure trends through key performance indicators (KPIs) like values and goals.
Create KPI: This video contains how to create an OPNBI Ccard widget.
tip
Only users with Dashboard privilege have access to this section!
Read 5 minutes tutorial here.
In this tutorial, we will understand how the KPI widget is created and how it functions.
We will display the current and target sales values in different countries across the globe to do so.
To add the KPI Widget in the dashboard, follow the steps below: -
Click on the Card icon from the top right corner menu, a list of the available component will open up as follows:

Click on Component Icon from the list of the component into the dashboard, a configuration box would open as follows:
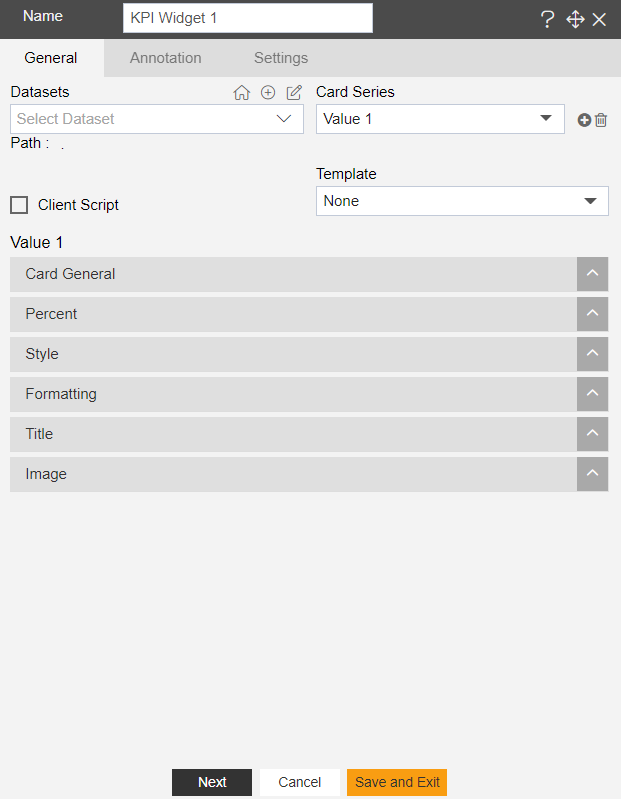
Provide a name to your KPI widget against the Name textbox as shown in the figure.
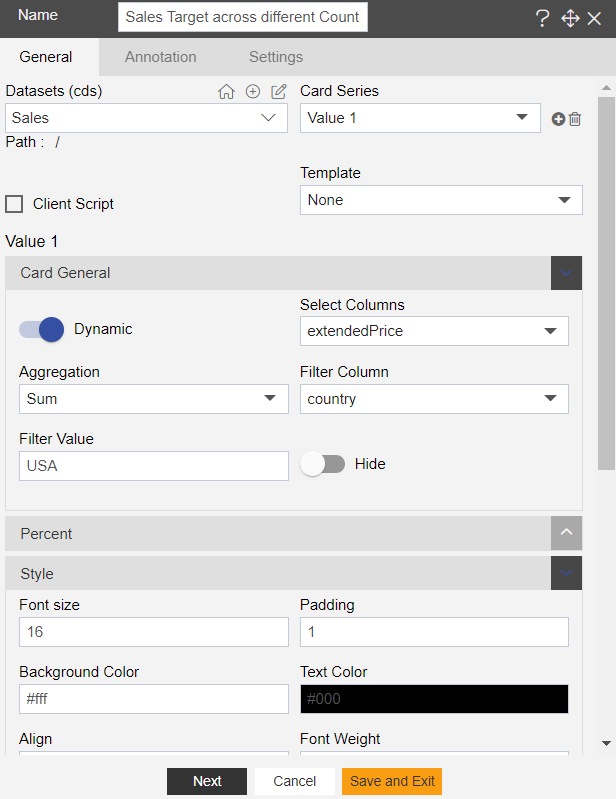
Select your desired dataset from the drop-down menu. For this example, we will be working with the Sales.cds dataset.
We will be keeping values as dynamic to obtain the values from the database. If the value is kept static, then the user has to manually enter the value.
Select extendedPrice from the Select Columns list and Aggregator as Sum, Filter Column as Country, and Filter Value as the USA.
By doing so, the user instructs the KPI widget to find the total sales of products in the USA.
The condition and condition value specify what condition must be applied to the filter column to make a comparison and what should be its value.
In our case, we will find the total sales of products whose extendedPrice is greater than 5000 in the USA.
All these fields are specified as follows:-
Keep values of all other fields as shown in the figure.
Toggle Abbreviation (to keep format like 3.6M) and Comma Separators (to insert commas after every 3 0's from right) as shown in the figure to modify the value of the KPI widget.
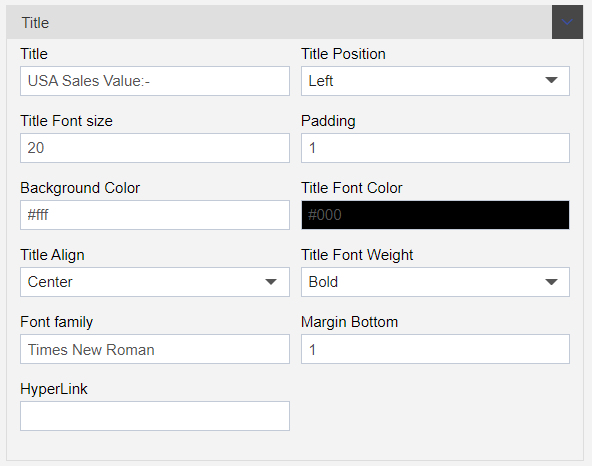
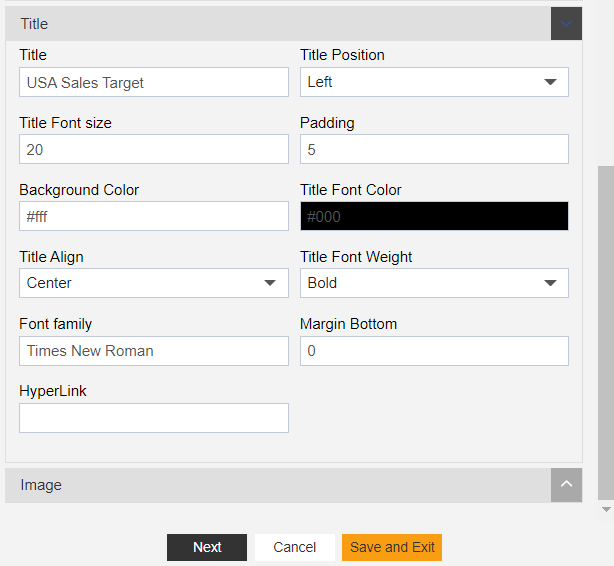
You can also add a title as shown in the figure below:-
After making these changes, the KPI widget will be displayed as follows:-

Now to specify the USA target value, add another Aggregator by clicking on an icon next to Aggregator and selecting it from the drop-down menu.
This will open the following dialog box:-
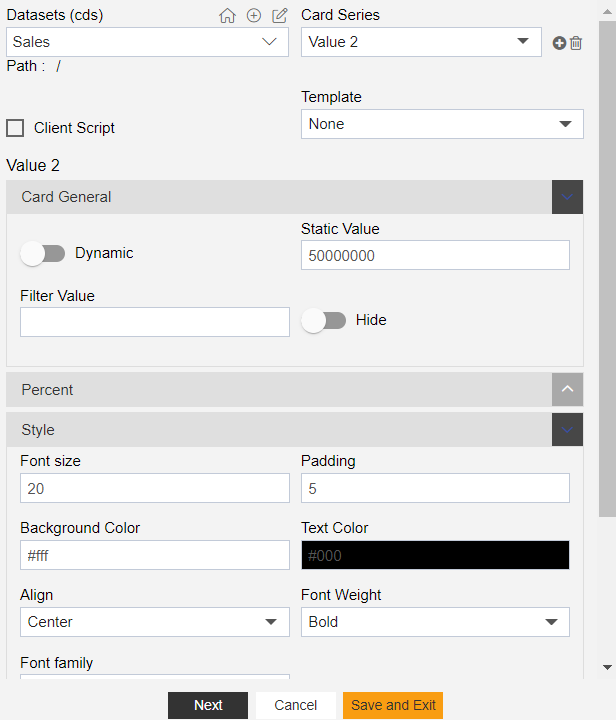
Disable dynamic toggle to input static values for the target as shown in the figure above.
Leave everything else as before.
Change the title of the second value as follows:-
After this, the KPI widget will be displayed as follows:-

To save your changes, click on the Save button located at the topmost right corner of the dashboard.
In a similar manner, you can compare current sales value and the target to be achieved across the different nations of the world as follows:-
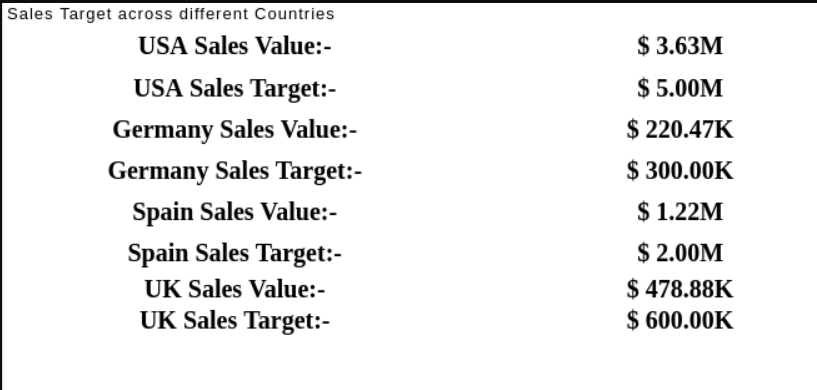
In this manner, you can use the KPI widget to compare the current sales of products and how much more sales need to be done to reach the target.