Formatting Table Widget
Formatting Table: This video contains how can user format and add any desired change to the table in OPNBI.
tip
Only users with Dashboard privilege have access to this section!
Read 5 minutes tutorial here.
To Format a Table follow the steps below:
- Value Formatter
Click on Hamburger Icon.

Click on visualization tab and open Table Widget in edit mode.

The Edit menu box appears as you click on Table Widget icon. And a widget gets added in content place automatically in dashboard.
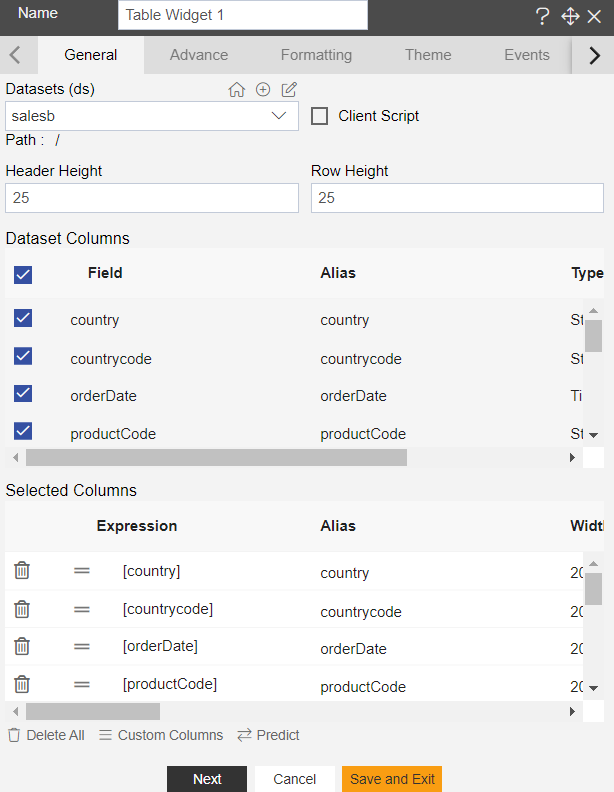
Enter Following details in General Property.
- Dataset: salesb.ds
- Select all the field in Dataset Columns
Fill above details as shown in figure below:
Click on Formatting Property.
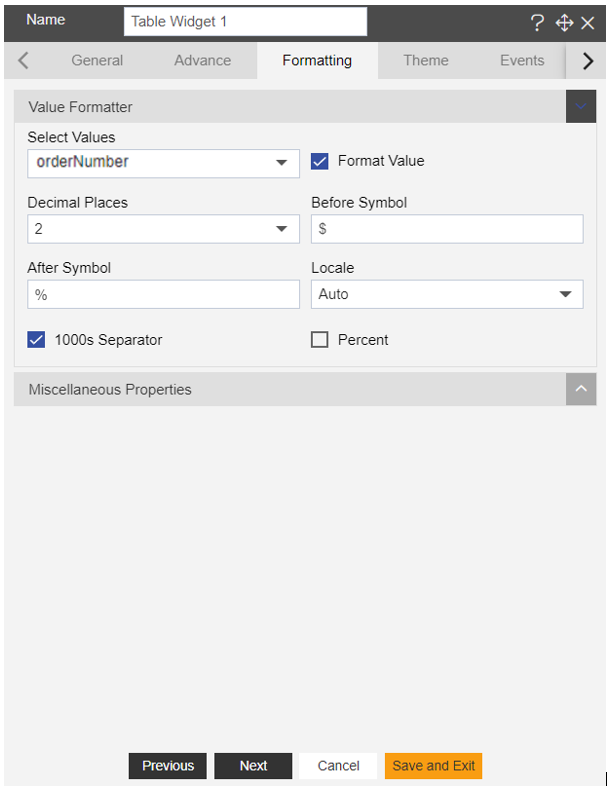
Enter following details in Value Formatter.
- Select Value: orderNumber
- Toggle Format Value
- Decimal Places: 2
- Before Symbol: $
- After Symbol: %
- Toggle 1000s Separator
Fill above details, As shown in figure below:
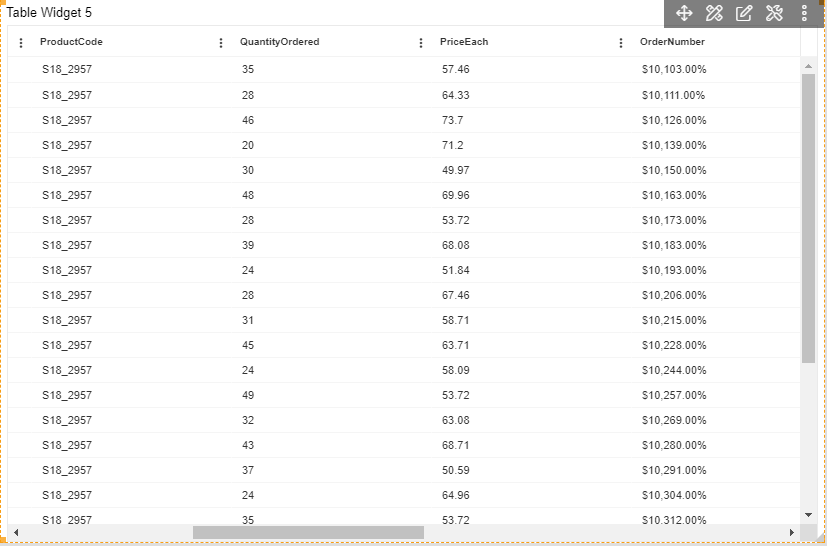
Click on Preview and Save and Exit. 10. Now, match your Table Widget with the below example, it should look like the figure below:
- Miscellaneous Properties
Click on Formatting Property.
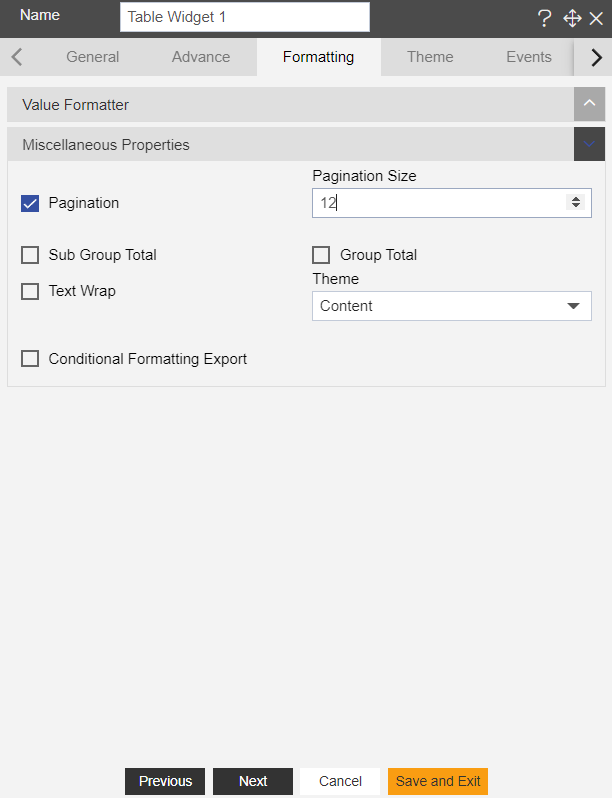
Enter following details in Miscellaneous Properties.
- Select Pagination
- Pagination Size:** 12
Fill above details, As shown in figure below:
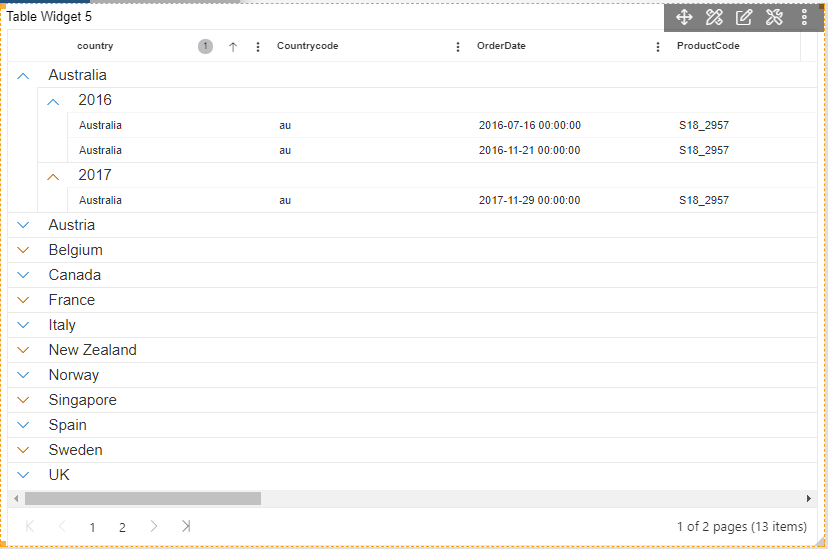
Click on Preview and Save and Exit.
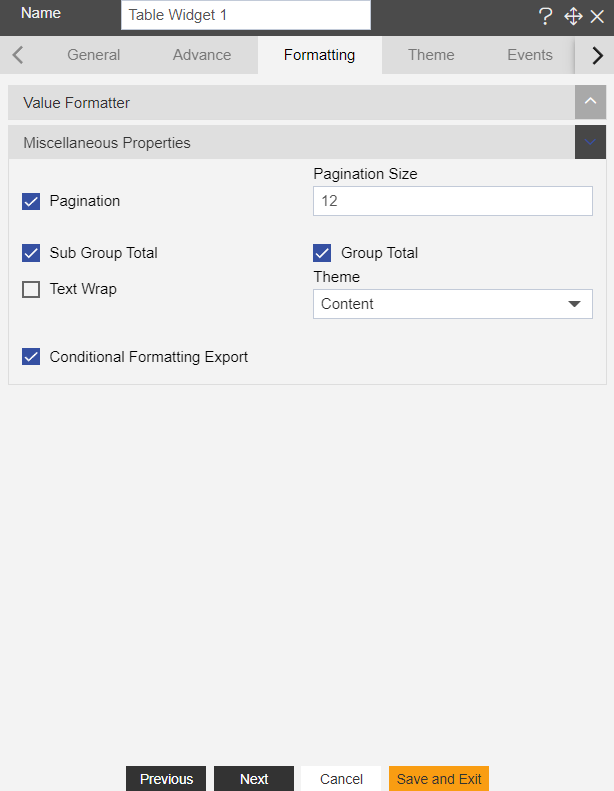
Enter following details in Miscellaneous Properties.
- Select Sub Group Total
- Select Group Total
- Select Conditional Formatting Export
Fill above details, As shown in figure below:
Click Preview and Save and Exit.
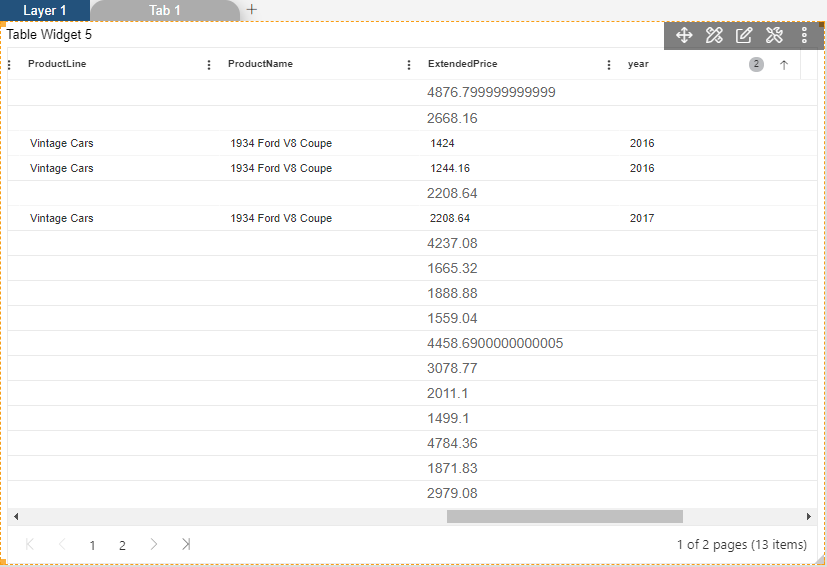
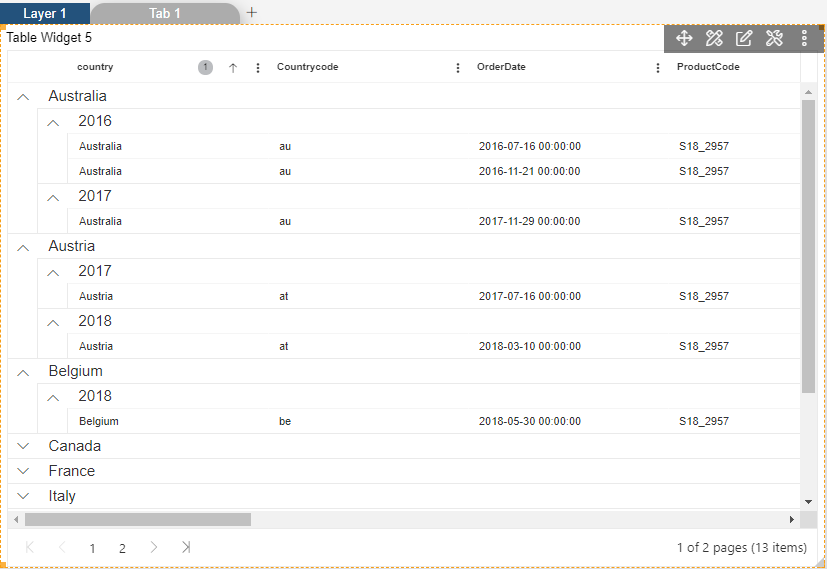
Now, match your Table Widget with the below example, it should look like the figure below: