Inflation
Introduction
Inflation is a decrease in the purchasing power of money, reflected in a general increase in the prices of goods and services in an economy.Inflation is a decrease in the purchasing power of money, reflected in a general increase in the prices of goods and services in an economy.
The condition of an increase in the wholesale price index of a necessary food item relative to the general index or the consumer price index (CPI) is referred to as food inflation.A consumer price index is a price index, the price of a weighted average market basket of consumer goods and services purchased by households.
Prerequisites:
Download the “World Energy Outlook.zip” file from Marketplace you should get the following folder structure.
• dashboards
• datasets
• datasources
• reports
• images
• resources
Consumer Inflation Tab:
Download Inflation Code.zip file from here
Country: It displays the total list of Country.

From the right vertical menu select the Card Widget and update the card Properties, as below:
Name: Consumer

Dataset: Inflation Consumer
Enter the following details in Card General Property
Select Columns: Country

Aggregation: Distinct Count
Enter the following details in Style Property
Background Color: rgba(255,255,255,0)

Text color: #ffffff
Enter the following details in Formatting Property
Decimal Place: 0
Enter the following details in Title Property
Title: Country

Title Position: Top

Background Color: rgba(189,189,189,0)

Title Font color: #ffffff

Title Font Weight: normal
Go to the Widget Setting and enter the following details in Widget Border Properties:
Border: Enable

Border Radius: Enable

Border Color: #ffffff

Top Left Radius: 20

Top Right Radius: 20

Bottom Left Radius: 20

Bottom Right Radius: 20
Enter the following details in Widget Icon Properties:
Hide Icon in Preview: Disable

Hide Maximize Icon: Enable

Hide Download Icon: Enable

Show Annotation Icon: Disable
Enter the following details in Widget Internal Area Properties:
Internal Area Padding: 0px 0px
Enter the following details in Background Properties:
Panel Background Color: rgba(255,255,255,0)

Maximize Widget Background Color: rgba(255,255,255,0)

Widget Background Color: rgba(255,255,255,0)
Enter the following details in Title Properties:
Show Title: Disable
Click on Save and Exit.
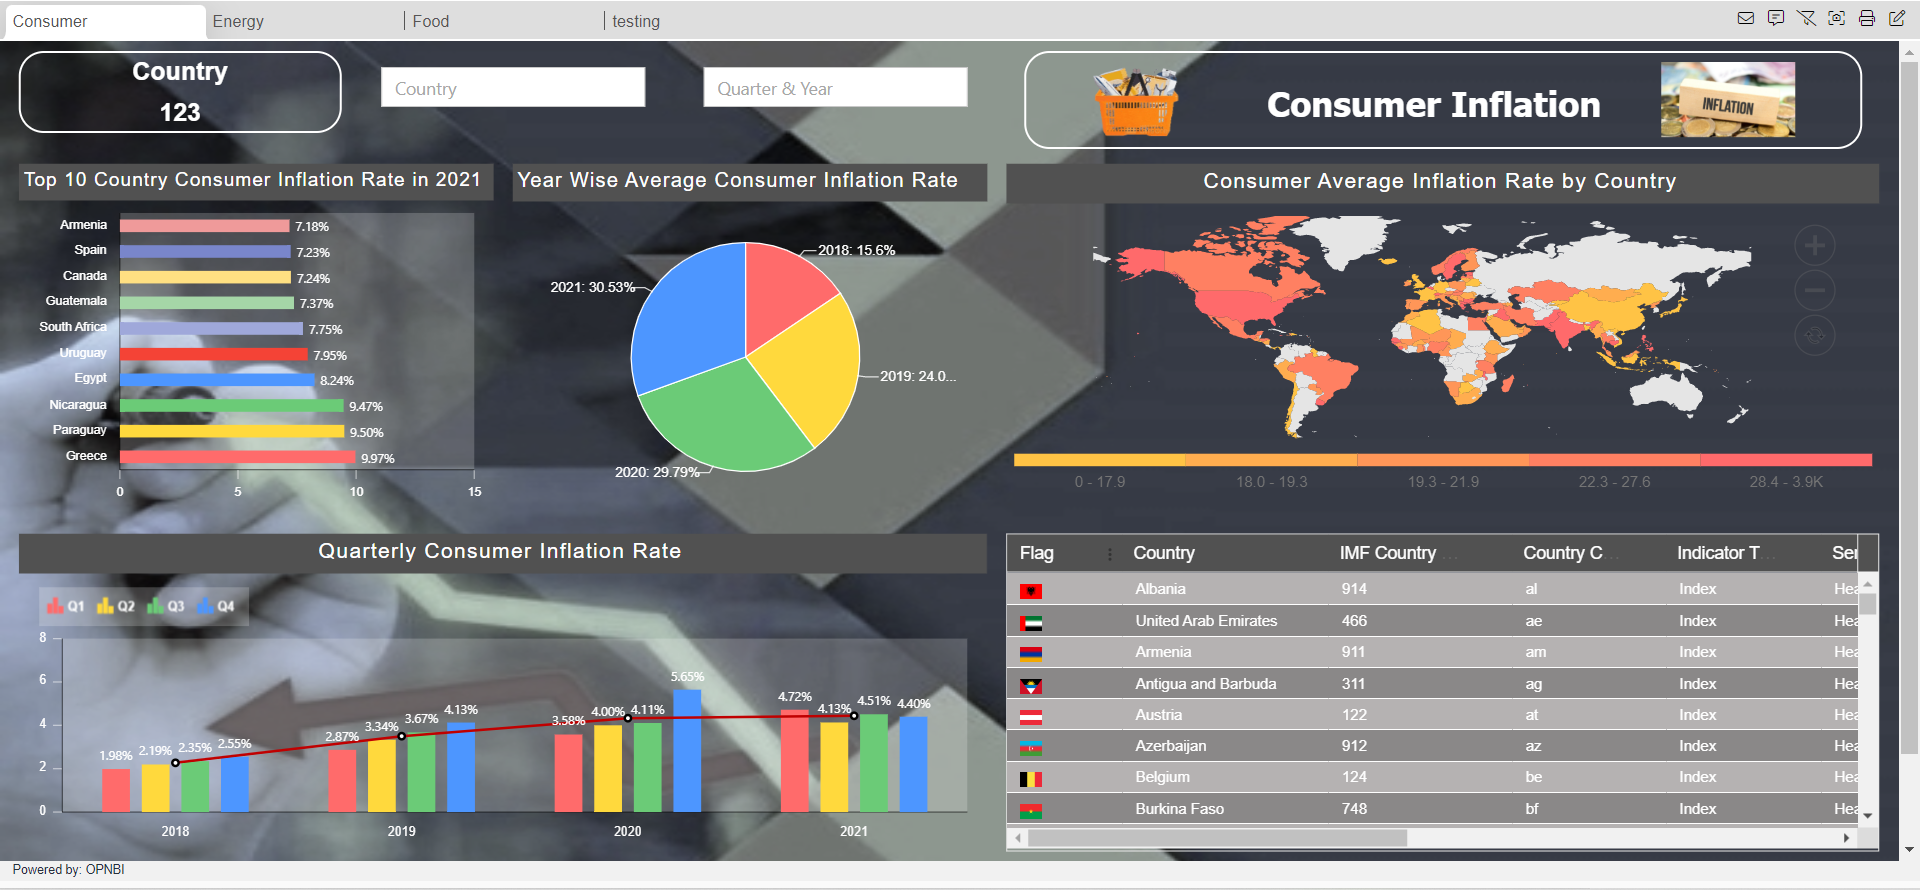
Top 10 Country Consumer Inflation Rate in 2021: It displays information of Top 10 Country Consumer Inflation Rate in year 2021.
From the Right vertical menu select the chart widget and enter the following details in the Clustered Bar Chart Property.
Name: Top 10 Country Consumer Inflation Rate in 2021

Dataset: Inflation Consumer.ds

Client Script: Enable (Client script provided in client script >> Top 10 Country Consumer Inflation Rate in 2021 file, Write the code in Client Script Property and click on Preview and Update Metadata.)

Category Axis: Country

Value Column: Price

Aggregation: sum
Go to the Formatting property and enter the following details in General.
Color & Theme Property: Enable Color by Category

Color List: #FF6B6B,#FFD93D,#6BCB77,#4D96FF,#F44336,#9FA8DA,#A5D6A7,#FFE082,#7986CB,#EF9A9A

Chart Background Area >> Background Opacity: 0.2
Enter the following details in the Category Axis Property.
Category Labels >> ALignment: Trim

Category Font Property >> Color : #ffffff

Font Size: 13

Category Ticks: Disable
Enter the following details in the Value Axis Property.
Value Font Property >> Color : #ffffff

Font Size: 13

Category Ticks >> Border Color: #ffffff
Enter the following details in Series Property.
Series General Properties >> Series Name: 2021

Series Value Labels Position: Enable

Text: <div>${point.y}%</div>
Go to the Widget Setting and enter the following details in Widget Icon Properties:
Hide Icon in Preview: Disable

Hide Maximize Icon: Enable

Hide Download Icon: Enable

Show Annotation Icon: Disable
Enter the following details in Background Properties:
Panel Background Color: rgba(255,255,255,0)

Maximize Widget Background Color: rgba(255,255,255,0)

Widget Background Color: rgba(255,255,255,0)
Enter the following details in Title Properties:
Title Color: #ffffff

Title Font Size: 15

Title Background Color: #515151

Padding: 4px 8px 8px 4px
Enter the following details in Filter Properties:
Show Filter Value: Enable
Click on Save and Exit.
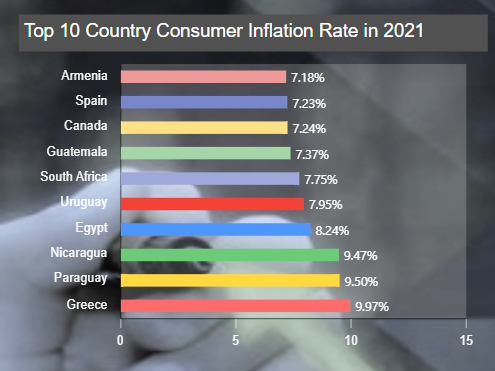
Year Wise Average Consumer Inflation Rate: It display Average of Consumer Inflation Rate by Year.
From the Right vertical menu select the chart widget and enter the following details in the Pie Chart Property.
Name: Year Wise Average Consumer Inflation Rate

Dataset: Inflation Consumer.ds

Client Script: Enable (Client script provided in client script >> Year Wise Average Consumer Inflation Rate file, Write the code in Client Script Property and click on Preview and Update Metadata.)

Category Axis: Year

Value Column: Price

Aggregation: Avg
Go to the Formatting property and enter the following details in General.
Color & Theme Property >> Color List: #FF6B6B,#FFD93D,#6BCB77,#4D96FF
Enter the following details in Series Property.
Series General Properties >> Series Name: Year

Series Ticks >> Color: #ffffff

Series Labels >> Color >> #ffffff

Font Size: 13

Truncate: Enable
Go to the Widget Setting and enter the details (follow the Widget setting property of Top 10 Country Consumer Inflation Rate in 2021 chart)
Click on Save and Exit.
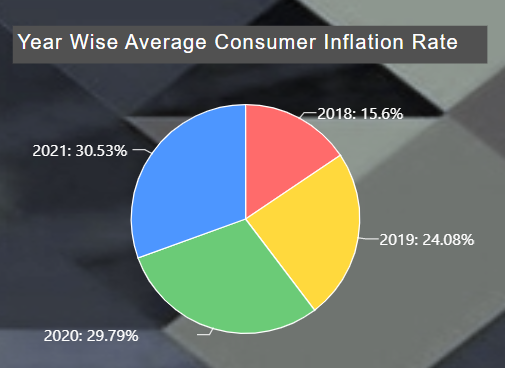
Consumer Average Inflation Rate by Country: It displays the Average of Consumer Inflation Rate by Country.
From the Right vertical menu select the Map widget and enter the following details in the Geo Map (World) Property.
Name: Consumer Average Inflation Rate by Country

Map Type: World

Dataset: Inflation Consumer.ds

Client Script: Enable (Client script provided in client script >> Consumer Average Inflation Rate by Country file, Write the code in Client Script Property and click on Preview and Update Metadata.)

Location: Country

Value: Price/ 100

Aggregation: Sum
Go to the Formatting property and enter the following details in Map Series.
Heat Legend: Enable Heat Legend

Tooltip >> Name: ${id} : ${value}%

Heat Rules >> Min Color: #ffd93d

Max Color: #ff6b6b
Go to the Widget Setting and enter the details (follow the Widget setting property of Top 10 Country Consumer Inflation Rate in 2021 chart)
Click on Save and Exit.
Quarterly Consumer Inflation Rate: It displays year wise Quarterly Consumer Inflation Rate.
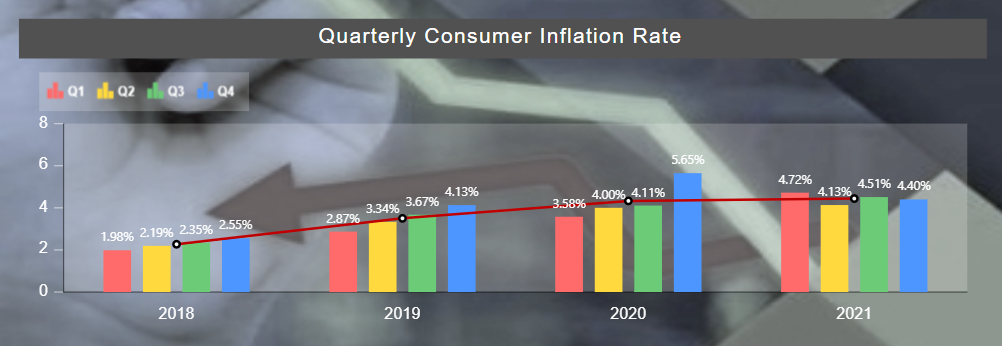
From the Right vertical menu select the chart widget and enter the following details in the Clustered Column Chart Property.
Name: Quarterly Consumer Inflation Rate

Dataset: Inflation Consumer.ds

Client Script: Enable (Client script provided in client script >> Quarterly Consumer Inflation Rate file, Write the code in Client Script Property and click on Preview and Update Metadata.)

Category Axis: Year

Value Column: Price/ 100

Aggregation: Avg

Optional Y series Grouping: Quater
Go to the Formatting property and enter the following details in General.
Color & Theme Property >> Color List: #FF6B6B,#FFD93D,#6BCB77,#4D96FF

Chart Background Area >> Background Opacity: 0.2

Chart Tooltip >> Tooltip Text: ${series.name} ${point.x} : ${point.y}%
Enter the following details in Category Axis Property.
Category Labels >> Alignment: Trim

Category Font Property >> Color: #ffffff

Font Size: 13

Category Ticks: Disable
Enter the following details in Value Axis Property.
Value Font Property >> Color: #ffffff

Font Size: 13

Value Ticks >> Border Color: #ffffff
Enter the following details in Series Property.
Series General Properties >> Series Name: 2018

Series Value Labels Position: Enable

Text: <div>${point.y}%</div>

Font Size: 11

Font Color: #ffffff
Enter the following details in Legend Property.
Legend Properties: Enable Legend

Legend Color: #ffffff

Legend Background >> Background Opacity: 0.2
Enter the following details in Trend Lines Property.
Click on + icon to create Trendline.
Enter the following details in General Property.
Aggregation: Avg

Value Column: Price/ 100

Bullets >> Bullet color: #000000
Go to the Widget Setting and enter the details (follow the Widget setting property of Top 10 Country Consumer Inflation Rate in 2021 chart)
Click on Save and Exit.
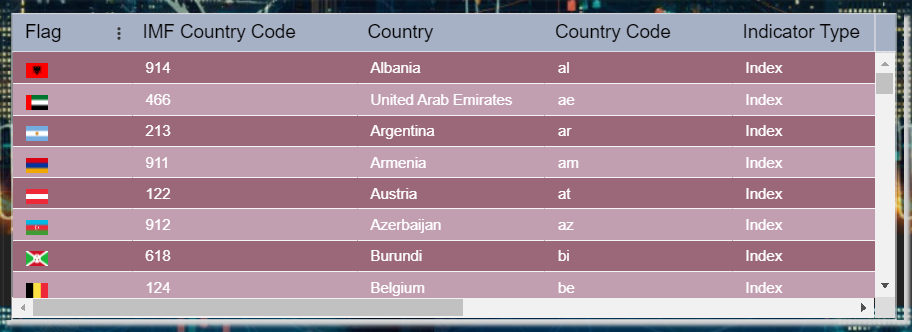
Detail Data Consumer Table:
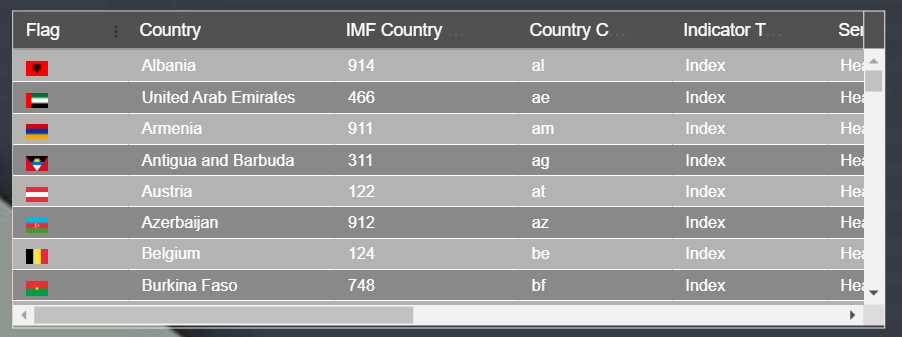
From the Right vertical menu select the Table widget and enter the following details in it.
Name: Detail Data

Dataset: Inflation Consumer.ds

Dataset Column: Select all the fields
Enter the following details in Theme Property.
Table Headers Properties >> Header Background Color: #515151

Header Font Color: #ffffff

Header Font Size: 14

Table Body Properties >> Table Body Background Color: rgba(255,255,255,0)

Table Body Font Size: 13

Row Border Color: #ffffff

Column Border Color: rgba(255,255,255,0)

Odd Row Background Color: #b5b2b2

Odd Row Font Color: #ffffff

Even Row Background Color: #8a8888

Even Row Font Color: #ffffff
Go to the Widget Setting and enter the details (follow the Widget setting property of Top 10 Country Consumer Inflation Rate in 2021 chart)
Enter the following details in Title Properties:
Show Title: Disable
Click on Save and Exit.
Country Filter: It displays the list of the Country used in Consumer Tab.

From the top right corner of the dashboard click on the filter Icon ![]() .
.
Click on + Icon ![]() to add filter and enter following details in it.
to add filter and enter following details in it.
Name: Consumer Country

Display name: Country

Event: On Change
Click on the Setting icon and enter the following details in the Filter widget.
Source: Dataset

Display Type: Multi-Select

Dataset: Inflation Consumer.ds

Column_Name: Country

Show name in Widget: Disable
Enter the following details in the Link Filter and widget Property.
Layer: Layer1

Tab: Consumer

Widgets: (Select all the widgets one by one and link the Country column with all the widgets)
Go to the Filter Property and add Quarter & Year Filter.
Quarter & Year: It display list of Quater and Year of Consumer.

Name: Consumer Year

Display name: Quarter & Year

Event: On Change
Click on the Setting icon and enter the following details in the Filter widget.
Source: Dataset

Display Type: Multi-Select

Dataset: Inflation Consumer.ds

Condition: Like

Column_Name: Duration

Show name in Widget: Disable
Enter the following details in the Link Filter and widget Property.
Layer: Layer1

Tab: Duration

Widgets: (Select all the widgets one by one and link the Duration column with all the widgets)
Go to the filter View Property and Click on the + icon of Country and Quarter & Year filter to add a filter in the Consumer Tab of the dashboard.
Click on Save and Exit.
Click on the Widget Setting icon of Country Filter and update the Property as below:
(Do same changes in Property of the Quarter & Year filter)
Enter the following details in Widget Icon Properties:
Hide Icon in Preview: Disable

Hide Maximize Icon: Enable

Show Annotation Icon: Disable
Enter the following details in Widget Background Properties:
Panel Background Color: rgba(255,255,255,0)

Maximize Widget Background Color: rgba(255,255,255,0)

Widget Background Color: rgba(255,255,255,0)
Enter the following details in Title Property
Show Title: Disable
Click on Preview and save and exit.
Consumer Inflation Title: Custom Visualization

From the right vertical menu select the Custom Visualization Widget and update the Properties, as below:
In HTML Properties enter the HTML code Provided in the HTML >> Consumer Inflation Title file.
In CSS Properties enter the CSS code Provided in the CSS >> Consumer Inflation Title file.
Go to the Widget Setting and enter the following details in Widget Background Properties:
Panel Background Color: rgba(255,255,255,0)

Maximize Widget Background Color: rgba(255,255,255,0)

Widget Background Color: rgba(255,255,255,0)
Enter the following details in Title Property
Show Title: Disable
Click on Preview and save and exit.
From the top right corner of the dashboard click on the Dashboard Setting Icon
Enter the following details in Tab Content Background.
Tab Canvas Background Color: rgba(255,255,255,0)

Background Image: Enable

Background Position: Center

Background Size: 100% 100%

upload & Select the Consumer Background image.
Click on Save And Exit.
Energy Tab:
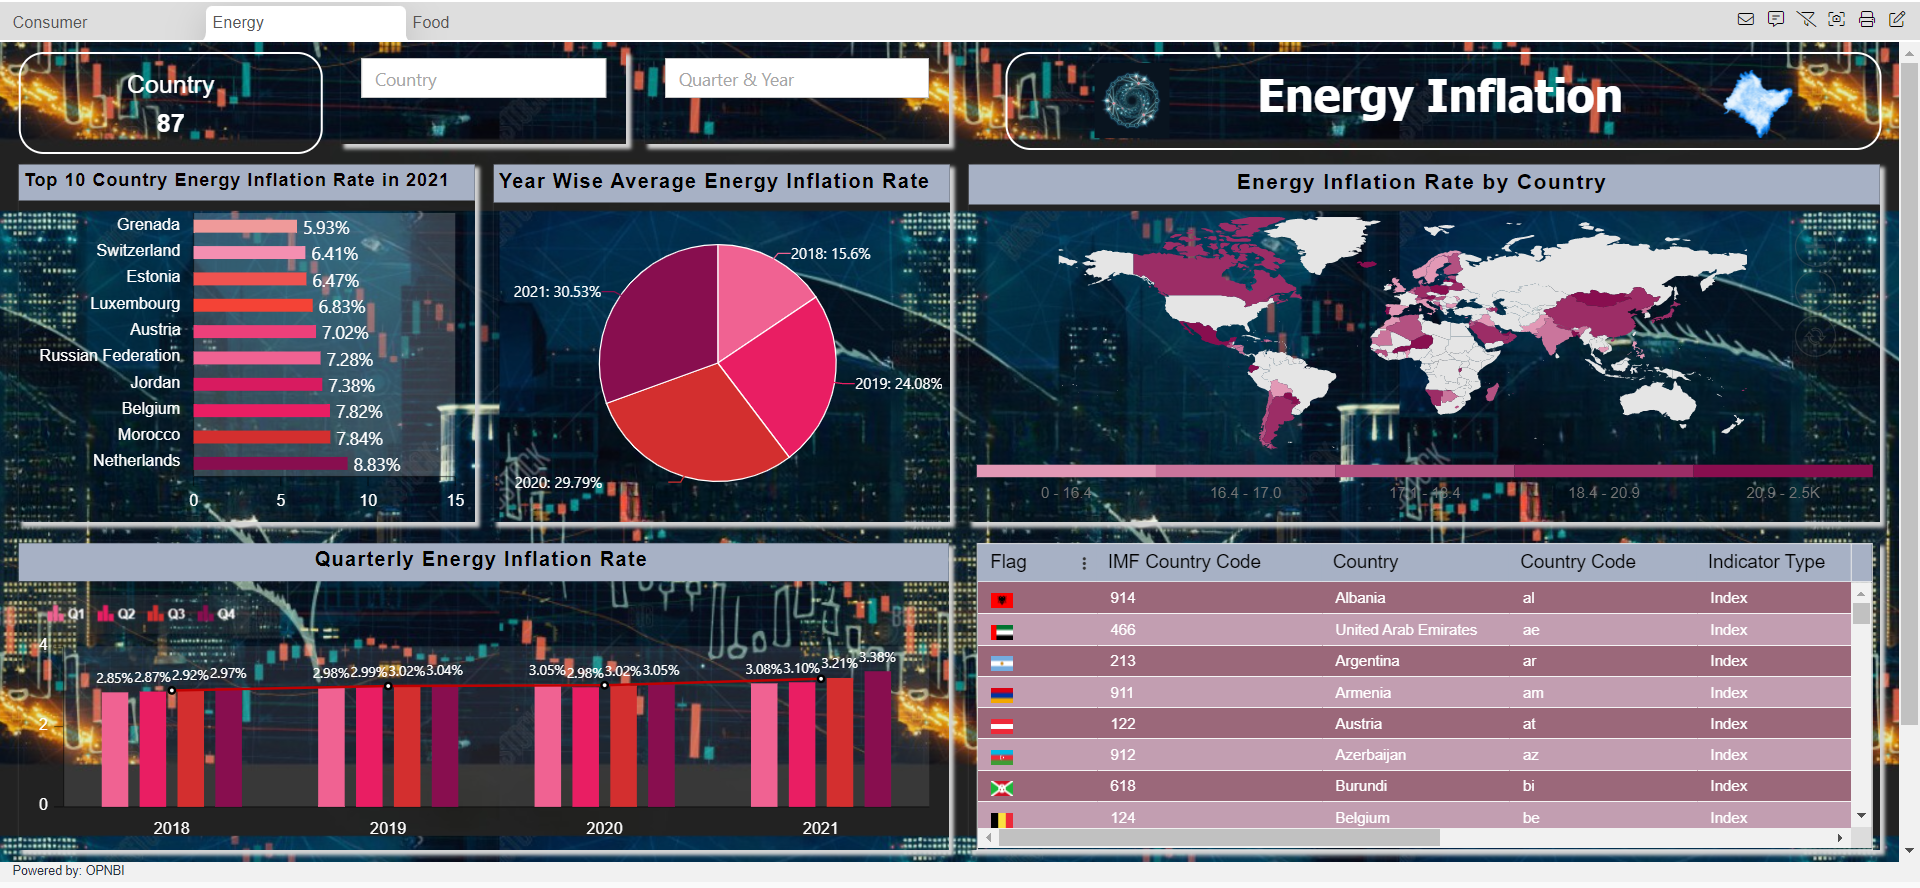
Country: It displays the total list of Country.

From the right vertical menu select the Card Widget and update the card Properties, as below:
Name: Energy

Dataset: Inflation Consumer
Enter the following details in Card General Property
Select Columns: Country

Aggregation: Distinct Count
Enter the following details in Style Property
Background Color: rgba(255,255,255,0)

Text color: #ffffff
Enter the following details in Formatting Property
Decimal Place: 0
Enter the following details in Title Property
Title: Country

Title Position: Top

Background Color: rgba(189,189,189,0)

Title Font color: #ffffff

Title Font Weight: normal
Go to the Widget Setting and enter the following details in Widget Border Properties:
Border: Enable

Border Radius: Enable

Border Color: #ffffff

Top Left Radius: 20

Top Right Radius: 20

Bottom Left Radius: 20

Bottom Right Radius: 20
Enter the following details in Widget Icon Properties:
Hide Icon in Preview: Disable

Hide Maximize Icon: Enable

Hide Download Icon: Enable

Show Annotation Icon: Disable
Enter the following details in Widget Internal Area Properties:
Internal Area Padding: 0px 0px
Enter the following details in Background Properties:
Panel Background Color: rgba(255,255,255,0)

Maximize Widget Background Color: rgba(255,255,255,0)

Widget Background Color: rgba(255,255,255,0)
Enter the following details in Title Properties:
Show Title: Disable
Click on Save and Exit.
Top 10 Country Energy Inflation Rate in 2021: It displays information of Top 10 Country Energy Inflation Rate in year 2021.
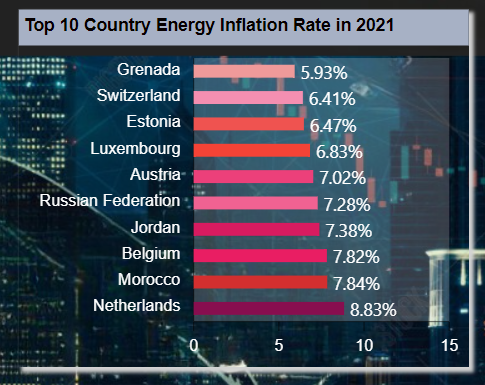
From the Right vertical menu select the chart widget and enter the following details in the Clustered Bar Chart Property.
Name: Top 10 Country Energy Inflation Rate in 2021

Dataset: Inflation Energy.ds

Client Script: Enable (Client script provided in client script >> Top 10 Country Energy Inflation Rate in 2021 file, Write the code in Client Script Property and click on Preview and Update Metadata.)

Category Axis: Country

Value Column: Price

Aggregation: sum
Go to the Formatting property and enter the following details in General.
Color & Theme Property: Enable Color by Category

Color List: #880e4f,#d32f2f,#e91e63,#D81B60,#f06292,#EC407A,#F44336,#EF5350,#F48FB1,#EF9A9A

Chart Background Area >> Background Opacity: 0.2
Enter the following details in the Category Axis Property.
Category Labels >> ALignment: Trim

Category Font Property >> Color : #ffffff

Font Size: 13

Category Ticks: Disable
Enter the following details in the Value Axis Property.
Value Font Property >> Color : #ffffff

Font Size: 13

Category Ticks >> Border Color: #ffffff
Enter the following details in Series Property.
Series General Properties >> Series Name: 2021

Series Value Labels Position: Enable

Font Size: 14

Text: <div>${point.y}%</div>
Go to the Widget Setting and enter the following details in Widget Box Shadow Properties:
Box Shadow: Enable

Box Shadow Horizontal: 3

Box Shadow Vertical: 3

Box Shadow Color: #d3d3d3

Box Shadow Blur: 3
Enter the following details in Widget Icon Properties:
Hide Icon in Preview: Disable

Hide Maximize Icon: Enable

Hide Download Icon: Enable

Show Annotation Icon: Disable
Enter the following details in Background Properties:
Panel Background Color: rgba(255,255,255,0)

Maximize Widget Background Color: rgba(255,255,255,0)

Widget Background Color: rgba(255,255,255,0)
Enter the following details in Title Properties:
Title Color: #060000

Title Font Size: 15

Title Background Color: #a7b1c5

Padding: 4px 8px 8px 4px
Enter the following details in Filter Properties:
Show Filter Value: Enable
Click on Save and Exit.
Year Wise Average Energy Inflation Rate: It display Average of Energy Inflation Rate by Year.
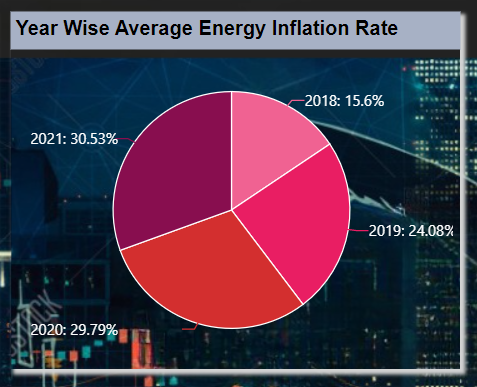
From the Right vertical menu select the chart widget and enter the following details in the Pie Chart Property.
Name: Year Wise Average Energy Inflation Rate

Dataset: Inflation Energy.ds

Client Script: Enable (Client script provided in client script >> Year Wise Average Energy Inflation Rate file, Write the code in Client Script Property and click on Preview and Update Metadata.)

Category Axis: Year

Value Column: Price

Aggregation: Avg
Go to the Formatting property and enter the following details in General.
Color & Theme Property >> Color List: #f06292,#e91e63,#d32f2f,#880e4f
Enter the following details in Series Property.
Series General Properties >> Series Name: Year

Series Ticks >> Inherit Property from Series: Enable

Series Labels >> Color >> #ffffff

Font Size: 13

Truncate: Enable
Go to the Widget Setting and enter the details (follow the Widget setting property of Top 10 Country Energy Inflation Rate in 2021 chart)
Click on Save and Exit.
Energy Inflation Rate by Country: It displays the Average of Energy Inflation Rate by Country.
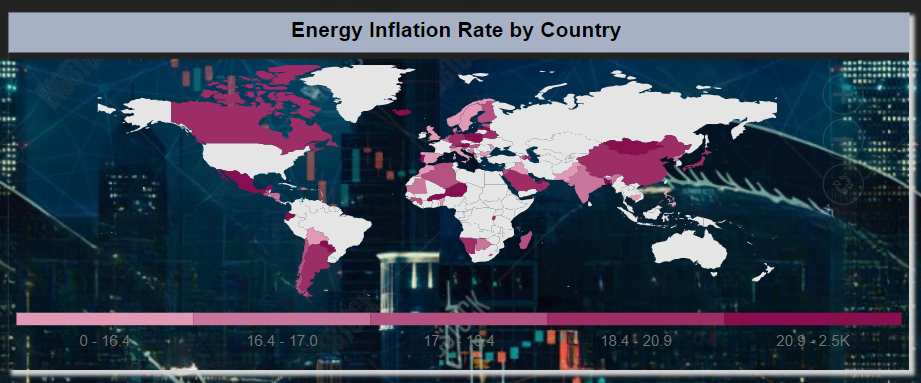
From the Right vertical menu select the Map widget and enter the following details in the Geo Map (World) Property.
Name: Energy Inflation Rate by Country

Map Type: World

Dataset: Inflation Energy.ds

Client Script: Enable (Client script provided in client script >> Energy Inflation Rate by Country file, Write the code in Client Script Property and click on Preview and Update Metadata.)

Location: Country

Value: Price/ 100

Aggregation: Sum
Go to the Formatting property and enter the following details in Map Series.
Heat Legend: Enable Heat Legend

Tooltip >> Name: ${id} : ${value}%

Heat Rules >> Min Color: #f8bbd0

Max Color: #880e4f
Go to the Widget Setting and enter the details (follow the Widget setting property of Top 10 Country Energy Inflation Rate in 2021 chart)
Click on Save and Exit.
Quarterly Energy Inflation Rate: It displays year wise Quarterly Energy Inflation Rate.
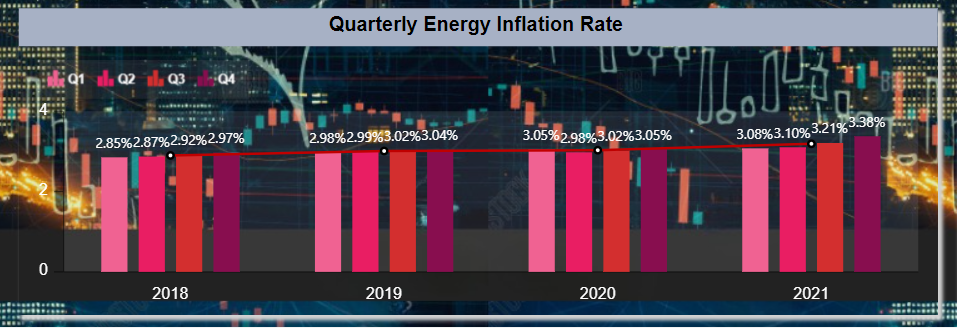
From the Right vertical menu select the chart widget and enter the following details in the Clustered Column Chart Property.
Name: Quarterly Energy Inflation Rate

Dataset: Inflation Energy.ds

Client Script: Enable (Client script provided in client script >> Quarterly Energy Inflation Rate file, Write the code in Client Script Property and click on Preview and Update Metadata.)

Category Axis: Year

Value Column: Price/ 100

Aggregation: Avg

Optional Y series Grouping: Quater
Go to the Formatting property and enter the following details in General.
Color & Theme Property >> Color List: #f06292,#e91e63,#d32f2f,#880e4f

Chart Background Area >> Background Opacity: 0.2

Chart Tooltip >> Tooltip Text: ${series.name} ${point.x} : ${point.y}%
Enter the following details in Category Axis Property.
Category Labels >> Alignment: Trim

Category Font Property >> Color: #ffffff

Font Size: 13

Category Ticks: Disable
Enter the following details in Value Axis Property.
Value Font Property >> Color: #ffffff

Font Size: 13
Enter the following details in Series Property.
Series General Properties >> Series Name: 2018

Series Value Labels Position: Enable

Text: <div>${point.y}%</div>

Font Size: 11

Font Color: #ffffff
Enter the following details in Legend Property.
Legend Properties: Enable Legend

Legend Color: #ffffff

Legend Background >> Background Opacity: 0.2
Enter the following details in Trend Lines Property.
Click on + icon to create Trendline.
Enter the following details in General Property.
Aggregation: Avg

Value Column: Price/ 100

Bullets >> Bullet color: #000000
Go to the Widget Setting and enter the details (follow the Widget setting property of Top 10 Country Energy Inflation Rate in 2021 chart)
Click on Save and Exit.
Detail Data Energy Table:
From the Right vertical menu select the Table widget and enter the following details in it.
Name: Detail Data

Dataset: Inflation Energy.ds

Dataset Column: Select all the fields
Enter the following details in Theme Property.
Table Headers Properties >> Header Background Color: #a7b1c5

Header Font Color: #000000

Header Font Size: 15

Table Body Properties >> Table Body Background Color: rgba(255,255,255,0)

Table Body Font Size: 13

Row Border Color: #f5f5f5

Column Border Color: rgba(255,255,255,0)

Odd Row Background Color: #9b687a

Odd Row Font Color: #ffffff

Even Row Background Color: #c29eb1

Even Row Font Color: #ffffff
Go to the Widget Setting and enter the details (follow the Widget setting property of Top 10 Country Energy Inflation Rate in 2021 chart)
Click on Save and Exit.
Country Filter: It displays the list of the Country used in Energy Tab.

From the top right corner of the dashboard click on the filter Icon ![]() .
.
Click on + Icon ![]() to add filter and enter following details in it.
to add filter and enter following details in it.
Name: Energy Country

Display name: Country

Event: On Change
Click on the Setting icon and enter the following details in the Filter widget.
Source: Dataset

Display Type: Multi-Select

Dataset: Inflation Energy.ds

Column_Name: Country

Show name in Widget: Disable
Enter the following details in the Link Filter and widget Property.
Layer: Layer1

Tab: Energy

Widgets: (Select all the widgets one by one and link the Country column with all the widgets)
Go to the Filter Property and add Quarter & Year Filter.
Quarter & Year: It display list of Quater and Year of Energy.
Name: Energy Year

Display name: Quarter & Year

Event: On Change
Click on the Setting icon and enter the following details in the Filter widget.
Source: Dataset

Display Type: Multi-Select

Dataset: Inflation Energy.ds

Condition: Like

Column_Name: Duration

Show name in Widget: Disable
Enter the following details in the Link Filter and widget Property.
Layer: Layer1

Tab: Duration

Widgets: (Select all the widgets one by one and link the Duration column with all the widgets)
Click on the Widget Setting icon of Country Filter and update the Property as below:
(Do same changes in Property of the Quarter & Year filter)
Enter the following details in Widget Icon Properties:
Hide Icon in Preview: Disable

Hide Maximize Icon: Enable

Show Annotation Icon: Disable
Enter the following details in Widget Background Properties:
Panel Background Color: rgba(255,255,255,0)

Maximize Widget Background Color: rgba(255,255,255,0)

Widget Background Color: rgba(255,255,255,0)
Enter the following details in Title Property
Show Title: Disable
Click on Preview and save and exit.
Energy Inflation Title: Custom Visualization

From the right vertical menu select the Custom Visualization Widget and update the Properties, as below:
In HTML Properties enter the HTML code Provided in the HTML >> Energy Inflation Title file.
In CSS Properties enter the CSS code Provided in the CSS >> Energy Inflation Title file.
Go to the Widget Setting and enter the following details in Widget Background Properties:
Panel Background Color: rgba(255,255,255,0)

Maximize Widget Background Color: rgba(255,255,255,0)

Widget Background Color: rgba(255,255,255,0)
Enter the following details in Title Property
Show Title: Disable
Click on Preview and save and exit.
From the top right corner of the dashboard click on the Dashboard Setting Icon and enter the following details in Tab Content Background.
Tab Canvas Background Color: rgba(255,255,255,0)

Background Image: Enable

Background Position: Center

Background Size: 100% 100%

upload & Select the Energy Background image.
Click on Save And Exit.
Food Tab:
Country: It displays the total list of Country.

From the right vertical menu select the Card Widget and update the card Properties, as below:
Name: Food

Dataset: Inflation Food.ds
Enter the following details in Card General Property
Select Columns: Country

Aggregation: Distinct Count
Enter the following details in Style Property
Background Color: rgba(255,255,255,0)

Text color: #000000
Enter the following details in Formatting Property
Decimal Place: 0
Enter the following details in Title Property
Title: Country

Title Position: Top

Background Color: rgba(255,255,255,0)

Title Font color: #000000

Title Font Weight: normal
Go to the Widget Setting and enter the following details in Widget Box Shadow Properties:
Box Shadow: Enable

Box Shadow Horizontal: 3

Box Shadow Vertical: 3

Box Shadow Color: #4d4848

Box Shadow Blur: 3
Enter the following details in Widget Icon Properties:
Hide Icon in Preview: Disable

Hide Maximize Icon: Enable

Hide Download Icon: Enable

Show Annotation Icon: Disable
Enter the following details in Widget Internal Area Properties:
Internal Area Padding: 0px 0px
Enter the following details in Background Properties:
Panel Background Color: rgba(255,255,255,0)

Maximize Widget Background Color: rgba(255,255,255,0)

Widget Background Color: rgba(255,255,255,0)
Enter the following details in Title Properties:
Show Title: Disable
Click on Save and Exit.
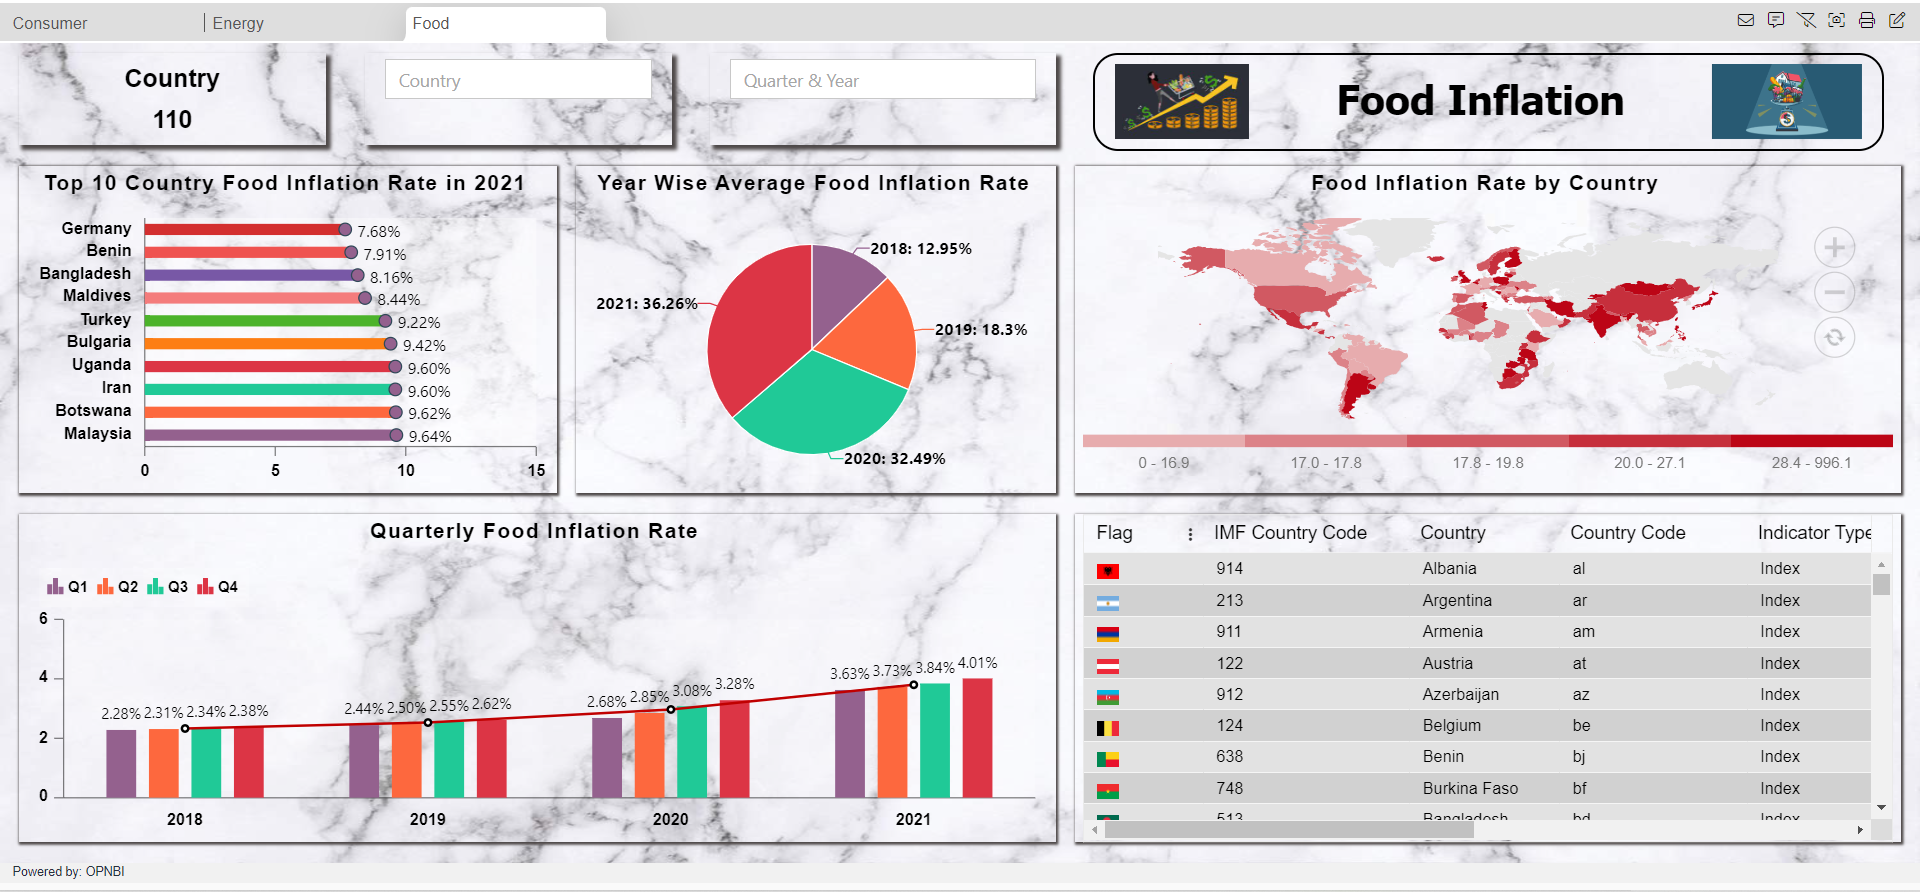
Top 10 Country Food Inflation Rate in 2021: It displays information of Top 10 Country Food Inflation Rate in year 2021.
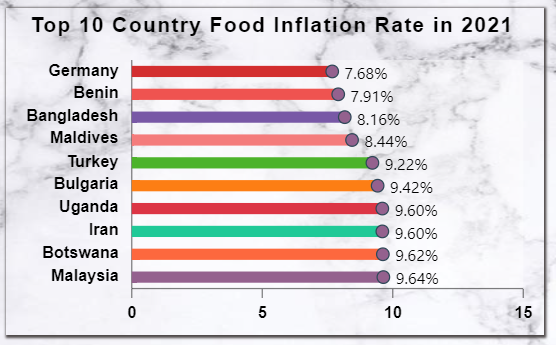
From the Right vertical menu select the chart widget and enter the following details in the Clustered Bar Chart Property.
Name: Top 10 Country Food Inflation Rate in 2021

Dataset: Inflation Food.ds

Client Script: Enable (Client script provided in client script >> Top 10 Country Food Inflation Rate in 2021 file, Write the code in Client Script Property and click on Preview and Update Metadata.)

Category Axis: Country

Value Column: Price

Aggregation: sum
Go to the Formatting property and enter the following details in General.
Color & Theme Property: Enable Color by Category

Color List: #94618e,#fd683e,#20c997,#dc3545,#fd7e14,#4cb32b,#F47C7C,#7858A6,#EF5350,#D32F2F

Chart Background Area >> Background Opacity: 0.2
Enter the following details in the Category Axis Property.
Category Labels >> ALignment: Trim

Category Font Weight: Bold

Font Size: 13

Category Ticks: Disable
Enter the following details in the Value Axis Property.
Font Weight: Bold

Font Size: 13
Enter the following details in Series Property.
Series General Properties >> Series Name: 2021

Series Value Labels Position: Enable

Font Size: 13

Text: <div>${point.y}%</div>
Go to the Widget Setting and enter the following details in Widget Box Shadow Properties:
Box Shadow: Enable

Box Shadow Horizontal: 1

Box Shadow Vertical: 1

Box Shadow Color: #4d4848

Box Shadow Blur: 2
Enter the following details in Widget Icon Properties:
Hide Icon in Preview: Disable

Hide Maximize Icon: Enable

Hide Download Icon: Enable

Show Annotation Icon: Disable
Enter the following details in Background Properties:
Panel Background Color: rgba(255,255,255,0)

Maximize Widget Background Color: rgba(255,255,255,0)

Widget Background Color: rgba(255,255,255,0)
Enter the following details in Title Properties:
Title Move To: Center

Title Color: #060000

Title Font Size: 17

Title Font Weight: Bold

Padding: 4px 8px 8px 4px
Enter the following details in Filter Properties:
Show Filter Value: Enable
Click on Save and Exit.
Year Wise Average Food Inflation Rate: It display Average of Energy Inflation Rate by Year.
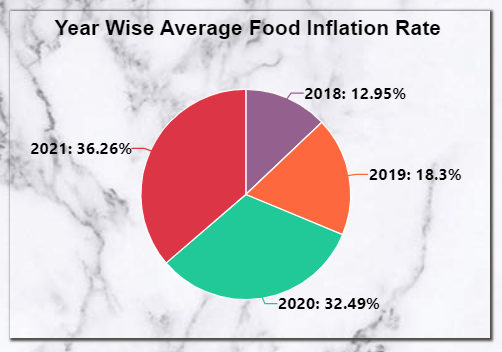
From the Right vertical menu select the chart widget and enter the following details in the Pie Chart Property.
Name: Year Wise Average Food Inflation Rate

Dataset: Inflation Food.ds

Client Script: Enable (Client script provided in client script >> Year Wise Average Food Inflation Rate file, Write the code in Client Script Property and click on Preview and Update Metadata.)

Category Axis: Year

Value Column: Price

Aggregation: Avg
Go to the Formatting property and enter the following details in General.
Color & Theme Property >> Color List: #94618e,#fd683e,#20c997,#dc3545
Enter the following details in Series Property.
Series General Properties >> Series Name: Year

Series Ticks >> Inherit Property from Series: Enable

Font Size: 13

Truncate: Enable
Go to the Widget Setting and enter the details (follow the Widget setting property of Top 10 Country Food Inflation Rate in 2021 chart)
Click on Save and Exit.
Food Inflation Rate by Country: It displays the Average of Food Inflation Rate by Country.
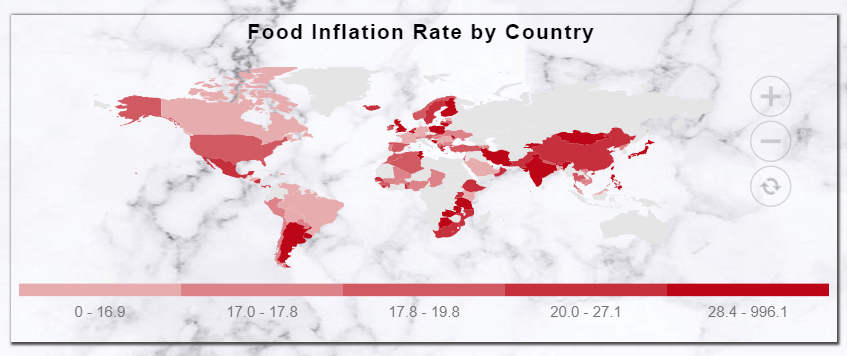
From the Right vertical menu select the Map widget and enter the following details in the Geo Map (World) Property.
Name: Food Inflation Rate by Country

Map Type: World

Dataset: Inflation Food.ds

Client Script: Enable (Client script provided in client script >> Food Inflation Rate by Country file, Write the code in Client Script Property and click on Preview and Update Metadata.)

Location: Country

Value: Price/ 100

Aggregation: Sum
Go to the Formatting property and enter the following details in Map Series.
Heat Legend: Enable Heat Legend

Tooltip >> Name: ${id} : ${value}%

Heat Rules >> Min Color: #f2d7d5

Max Color: #bc0516
Go to the Widget Setting and enter the details (follow the Widget setting property of Top 10 Country Food Inflation Rate in 2021 chart)
Click on Save and Exit.
Quarterly Food Inflation Rate: It displays year wise Quarterly Food Inflation Rate.
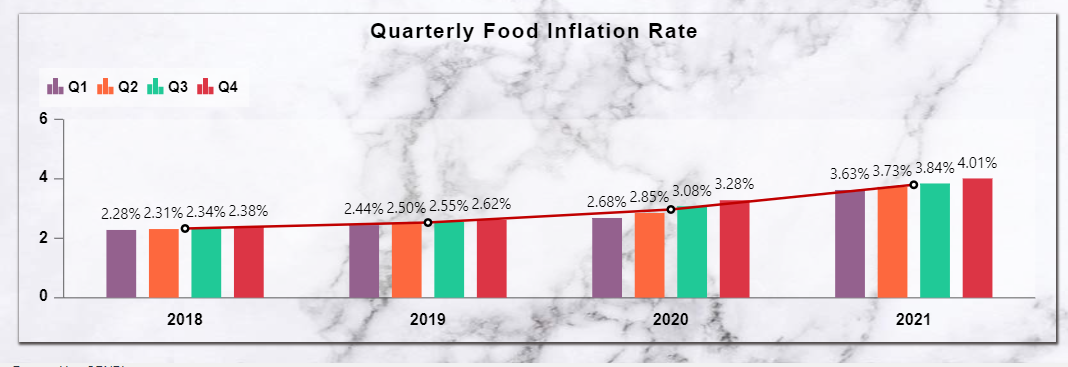
From the Right vertical menu select the chart widget and enter the following details in the Clustered Column Chart Property.
Name: Quarterly Energy Inflation Rate

Dataset: Inflation Food.ds

Client Script: Enable (Client script provided in client script >> Quarterly Food Inflation Rate file, Write the code in Client Script Property and click on Preview and Update Metadata.)

Category Axis: Year

Value Column: Price/ 100

Aggregation: Avg

Optional Y series Grouping: Quater
Go to the Formatting property and enter the following details in General.
Color & Theme Property >> Color List: #94618e,#fd683e,#20c997,#dc3545

Chart Background Area >> Background Opacity: 0.2

Chart Tooltip >> Tooltip Text: ${series.name} ${point.x} : ${point.y}%
Enter the following details in Category Axis Property.
Category Labels >> Alignment: Trim

Value Font Property >> Font Weight: Bold

Font Size: 13

Category Ticks: Disable
Enter the following details in Value Axis Property.
Value Font Property >> Font Weight: Bold

Font Size: 13
Enter the following details in Series Property.
Series General Properties >> Series Name: 2018

Series Value Labels Position: Enable

Text: <div>${point.y}%</div>

Font Size: 12

Font Color: #ffffff
Enter the following details in Legend Property.
Legend Properties: Enable Legend

Legend Font Properties >> Font Size: 12

Font Weight: Bold

Legend Background >> Background Opacity: 0.2
Enter the following details in Trend Lines Property.
Click on + icon to create Trendline.
Enter the following details in General Property.
Aggregation: Avg

Value Column: Price/ 100
Go to the Widget Setting and enter the details (follow the Widget setting property of Top 10 Country Food Inflation Rate in 2021 chart)
Click on Save and Exit.
Detail Data Food Table:
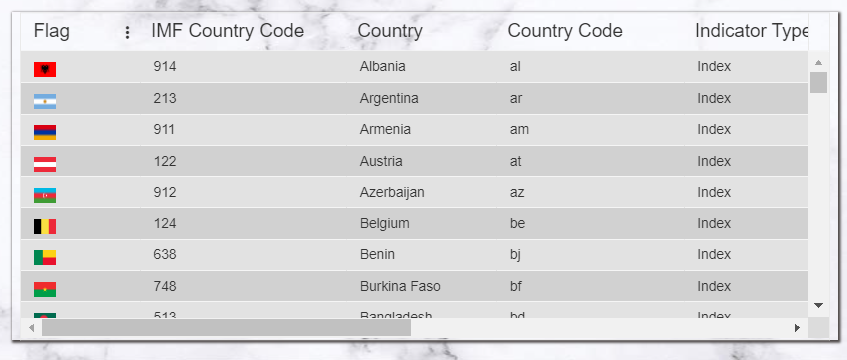
From the Right vertical menu select the Table widget and enter the following details in it.
Name: Detail Data

Dataset: Inflation Food.ds

Dataset Column: Select all the fields
Enter the following details in Theme Property.
Table Headers Properties >> Header Background Color: #a7b1c5

Header Font Color: #000000

Header Font Size: 15

Table Body Properties >> Table Body Background Color: rgba(255,255,255,0)

Table Body Font Size: 13

Row Border Color: #f5f5f5

Column Border Color: rgba(255,255,255,0)

Odd Row Background Color: #e2e2e2

Odd Row Font Color: #000000

Even Row Background Color: #d1d1d1

Even Row Font Color: #000000
Go to the Widget Setting and enter the details (follow the Widget setting property of Top 10 Country Food Inflation Rate in 2021 chart)
Click on Save and Exit.
Country Filter: It displays the list of the Country used in Food Tab.
From the top right corner of the dashboard click on the filter Icon ![]() .
.
Click on + Icon ![]() to add filter and enter following details in it.
to add filter and enter following details in it.
Name: Energy Country

Display name: Country

Event: On Change
Click on the Setting icon and enter the following details in the Filter widget.
Source: Dataset

Display Type: Multi-Select

Dataset: Inflation Food.ds

Column_Name: Country

Show name in Widget: Disable
Enter the following details in the Link Filter and widget Property.
Layer: Layer1

Tab: Food

Widgets: (Select all the widgets one by one and link the Country column with all the widgets)
Go to the Filter Property and add Quarter & Year Filter.
Quarter & Year: It display list of Quater and Year of Food Tab.
Name: Food Year

Display name: Quarter & Year

Event: On Change
Click on the Setting icon and enter the following details in the Filter widget.
Source: Dataset

Display Type: Multi-Select

Dataset: Inflation Food.ds

Condition: Like

Column_Name: Duration

Show name in Widget: Disable
Enter the following details in the Link Filter and widget Property.
Layer: Layer1

Tab: Duration

Widgets: (Select all the widgets one by one and link the Duration column with all the widgets)
Click on the Widget Setting icon of Country Filter and update the Property as below:
(Do same changes in Property of the Quarter & Year filter)
Enter the following details in Widget Icon Properties:
Hide Icon in Preview: Disable

Hide Maximize Icon: Enable

Show Annotation Icon: Disable
Enter the following details in Widget Background Properties:
Panel Background Color: rgba(255,255,255,0)

Maximize Widget Background Color: rgba(255,255,255,0)

Widget Background Color: rgba(255,255,255,0)
Enter the following details in Title Property
Show Title: Disable
Click on Preview and save and exit.
Food Inflation Title: Custom Visualization

From the right vertical menu select the Custom Visualization Widget and update the Properties, as below:
In HTML Properties enter the HTML code Provided in the HTML >> Food Inflation Title file.
In CSS Properties enter the CSS code Provided in the CSS >> Food Inflation Title file.
Go to the Widget Setting and enter the following details in Widget Background Properties:
Panel Background Color: rgba(255,255,255,0)

Maximize Widget Background Color: rgba(255,255,255,0)

Widget Background Color: rgba(255,255,255,0)
Enter the following details in Title Property
Show Title: Disable
Click on Preview and save and exit.
From the top right corner of the dashboard click on the Dashboard Setting Icon
Enter the following details in Tab Content Background.
Tab Canvas Background Color: rgba(255,255,255,0)

Background Image: Enable

Background Position: Center

Background Size: 100% 100%

upload & Select the Background image.
Click on Save And Exit.