Insurance
Introduction
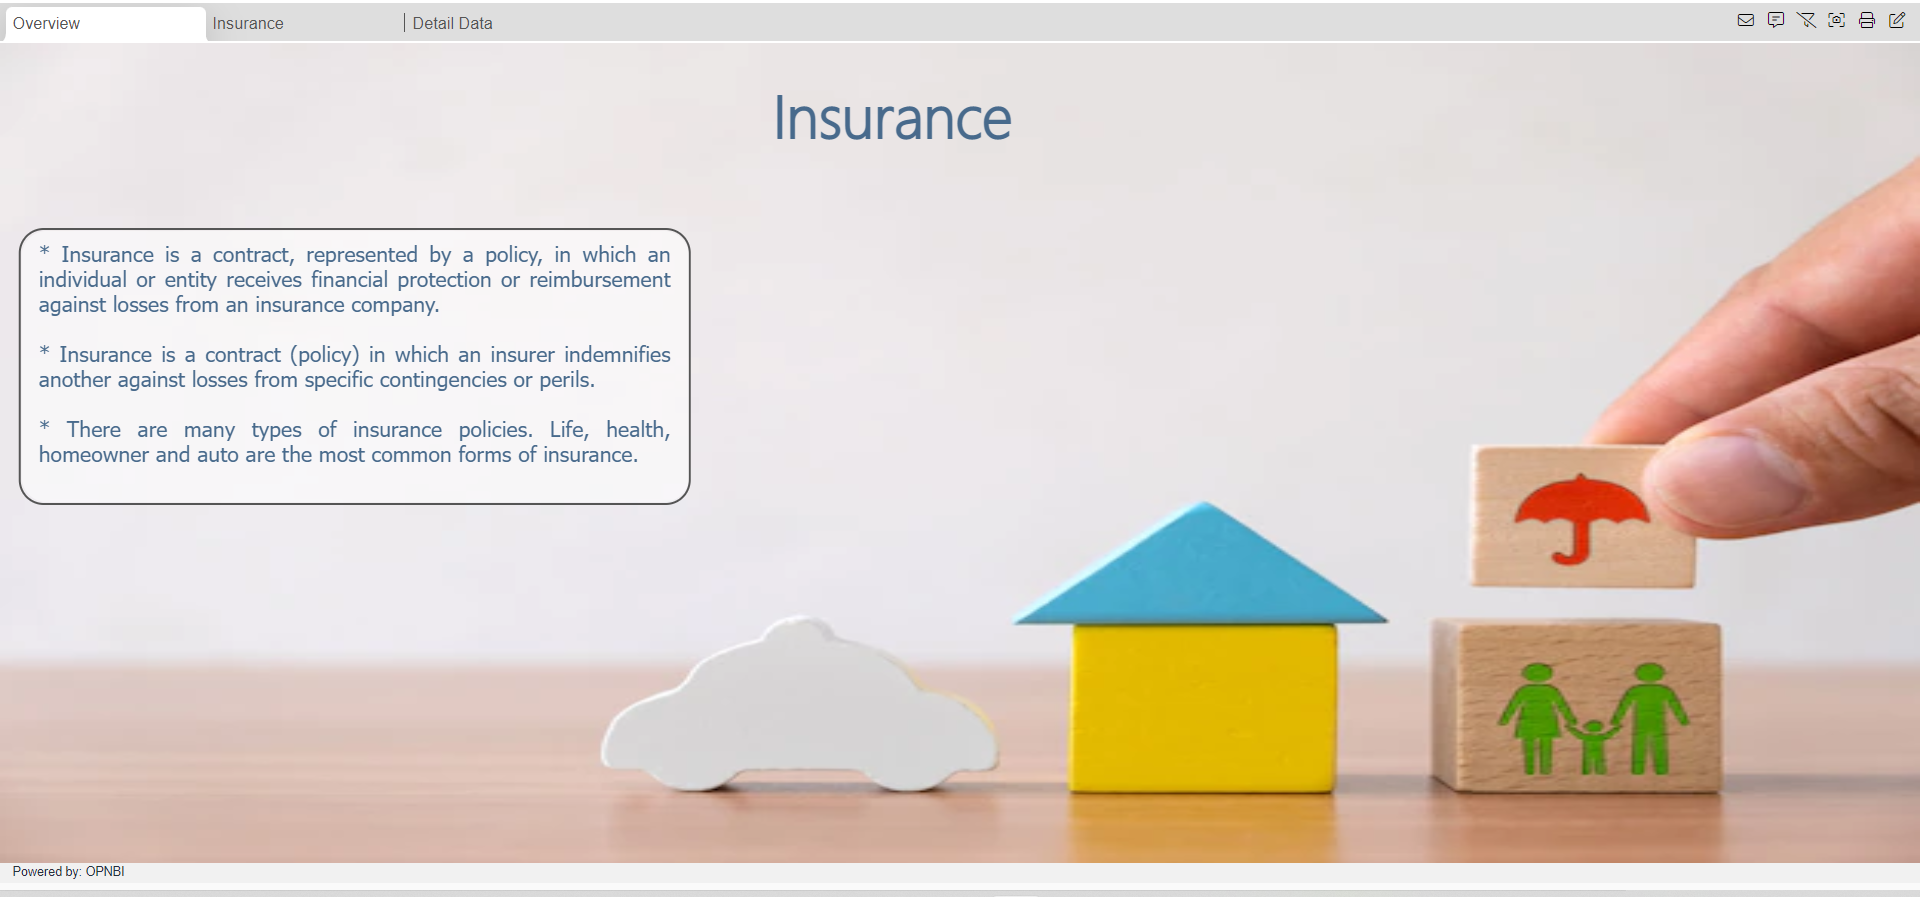
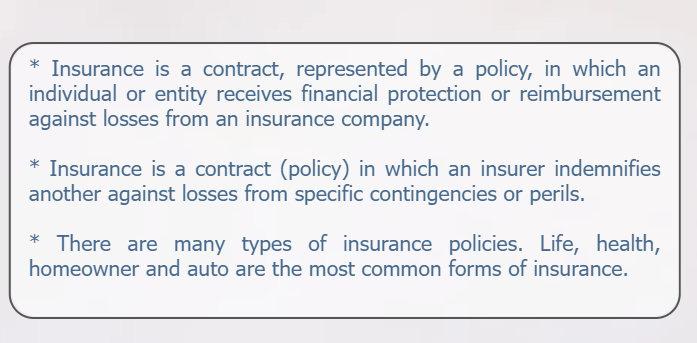
Insurance is a contract, represented by a policy, in which an individual or entity receives financial protection or reimbursement against losses from an insurance company.
Insurance is a contract (policy) in which an insurer indemnifies another against losses from specific contingencies or perils.There are many types of insurance policies. Life, health, homeowners, and auto are the most common forms of insurance.
Prerequisites:
Download and extract the “Insurance.zip” file from Marketplace you should get the following folder structure.
• dashboards
• datasets
• datasources
• reports
• images
• resources
Overview Tab:
Download InsuranceCode.zip file from here
From the right vertical menu of the dashboard select the Custom Visualization Widget and update the Properties, as below:
In HTML Properties enter the HTML code Provided in the HTML Folder >> Insurance Title file.
In CSS Properties enter the CSS code Provided in the CSS Folder >> Insurance Title file.
Go to the Widget Setting and enter the following details in Widget Background Properties:
Panel Background Color: rgba(255,255,255,0)

Maximize Widget Background Color: rgba(255,255,255,0)

Widget Background Color: rgba(255,255,255,0)
Enter the following details in Title Properties:
Show Title: Disable
Click on Preview and Save and Exit.
Description
From the right vertical menu select the Custom Visualization Widget and update the Properties, as below:
In HTML Properties enter the HTML code Provided in the HTML Folder >> description file.
Go to the Widget Setting and enter the details in Widget Border Properties:
Border: Enable

Border Radius: Enable

Border Width: 2px 2px 2px 2px

Top Left Radius: 20

Top right Radius: 20

Bottom Left Radius: 20

Bottom Right Radius: 20
Enter the following details in Background Properties:
Panel Background Color: rgba(255,255,255,0.4)

Maximize Widget Background Color: rgba(255,255,255,0.4)

Widget Background Color: rgba(255,255,255,0.4)
Enter the following details in Title Properties:
Show Title: Disable
Click on Preview and Save and Exit.
Insurance Tab
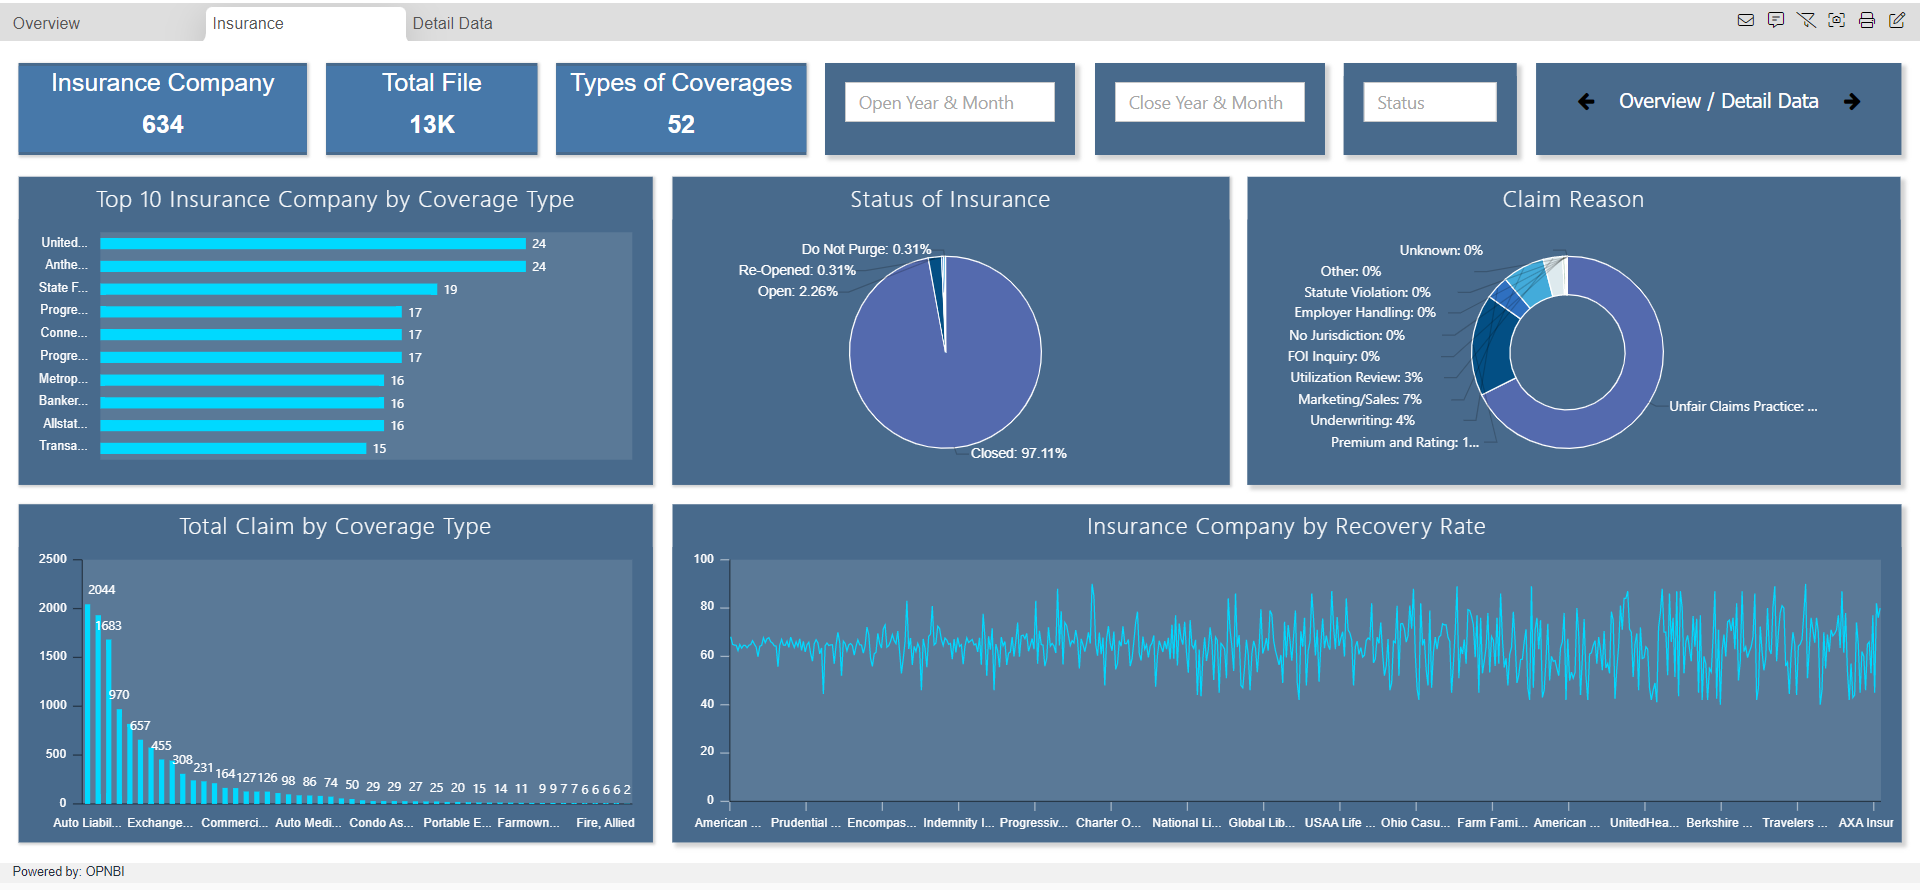
Insurance Company: it displays count of total Insurance Company.

From the right vertical menu select the Card Widget and update the card Properties, as below:
Name: Insurance Company

Dataset: Insurance
Enter the following details in Card General Property:
Select Columns: Company

Aggregation: Distinct Count
Enter the following details in Style Property
Font Size: 20

Paddding: 10

Background Color: #4778a9
Enter the following details in Formatting Property
Decimal Place: 0
Enter the following details in Title Property
Title: Insurance Company

Title Position: Top

Title Font Size: 20

Paddding: 1

Background Color: #4778a9

Title Font Weight: Normal

Font Family: Segoe UI Light
Go to the Widget Setting and enter the following details in Widget Box Shadow Properties:
Box Shadow: Enable

Box Shadow Horizontal: 3

Box Shadow Vertical: 3

Box Shadow Color: #d3d3d3

Box Shadow Blur: 3
Enter the following details in Widget Icon Properties:
Hide Icon In Preview: Disable

Hide Maximize Icon: Enable

Hide Download Icon: Enable
Enter the following details in Widget Internal Area Properties:
Internal Area Padding: 0px 0px
Enter the following details in Background Properties:
Panel Background Color: #486a8c

Maximize Widget Background Color: #486a8c

Widget Background Color: #486a8c
Enter the following details in Title Properties:
Show Title: Disable
Click on Save and Exit.
Click on Ellipse icon ![]() of the Insurance Company KPI widget and select the copy option.
of the Insurance Company KPI widget and select the copy option.
It will display the dialog box, as shown in the figure below:
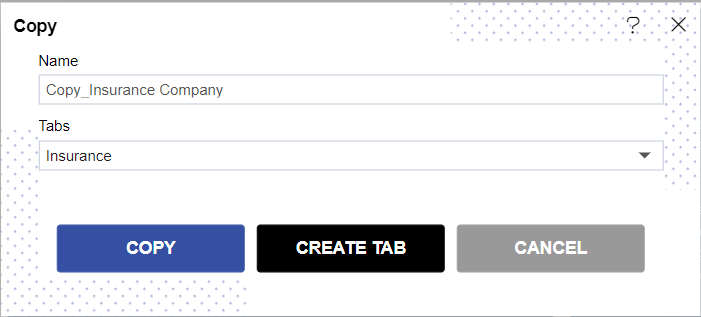
Click on the copy.
Total File: It displays information on the total number of insurance File.

Enter the following details in Card General Property, as below:
Name: Total File

Dataset: Insurance
Enter the following details in Card General Property:
Select Columns: Company

Aggregation: Count
Enter the following details in Title Property
Title: Total File
Click on Save and Exit.
Types of Coverages: It displays Total types of Coverages.

Copy the Total File KPI Widget and enter the following details in Types of Coverages KPI widget.
Enter the following details in Card General Property, as below:
Name: Types of Coverages

Dataset: Insurance
Enter the following details in Card General Property:
Select Columns: Coverage

Aggregation: Distinct Count
Enter the following details in Title Property
Title: Types of Coverages
Click on Save and Exit.
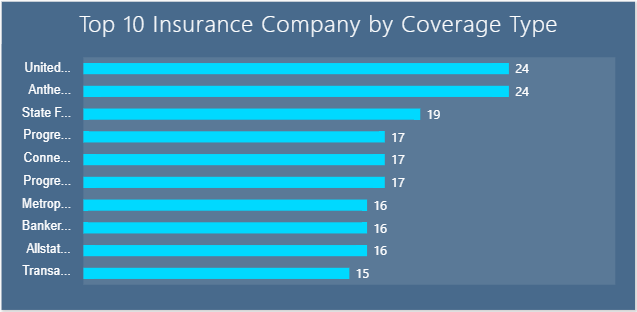
Top 10 Insurance Company by Coverage Type: It displays the Top Ten Insurance Company which have highest Coverage Type.
From the Right vertical menu select the chart widget and enter the following details in Clustered Bar Chart Property.
Name: Top 10 Insurance Company by Coverage Type

Dataset: Insurance.ds

Category Axis: Company

Value Column: Coverage

Aggregation: Sum

Client Script: Enable
Go to the Client Script Property and enter the OPNBI_SQL Code below:
select top 10 [Company], count(distinct[Coverage]) as [Coverage] from ? group by [Company] order by count(distinct[Coverage]) desc
Click on Preview and Update Metadata.
Go to the Formatting property and enter the following details in General:
Color & Theme Property: #00d9ff,#546aae,#034f84,#2f70c0,#43abda,#deeaee,#b1cbbb,#eea29a,#c94c4c,#ffef96,#bd5734,#a79e84,#50394c,#625750,#b2b2b2,#587e76,#f4e1d2

Chart Sorting Based on Value: Ascending

Chart Background Area >> Background Opacity: 0.1
Enter the following details in Category Axis.
Category Labels >> Alignment: Wrap

Truncate: Enable

Category Font Property >> Color: #ffffff

Category Ticks: Disable

Category Line: Disable Axis Line
Enter the following details in Value Axis.
Value Labels: Disable Labels

Value Ticks: Disable Ticks

Value Line: Disable Axis Line
Enter the following details in Series Property.
Series General Properties >> Series Name: Insurance Company

Decimal Places: 0
Go to the Widget Setting and enter the following details in Widget Box Shadow Properties:
Box Shadow: Enable

Box Shadow Horizontal: 3

Box Shadow Vertical: 3

Box Shadow Color: #d3d3d3

Box Shadow Blur: 3
Enter the following details in Widget Icon Properties:
Hide Icon In Preview: Disable

Hide Maximize Icon: Enable

Hide Download Icon: Enable
Enter the following details in Background Properties:
Panel Background Color: #486a8c

Maximize Widget Background Color: #486a8c

Widget Background Color: #486a8c
Enter the following details in Title Properties:
Title Move To: Center

Title Font Size: 18

Title Font Family: Segoe UI Light
Enter the following details in Filter Properties:
Show filter Value: Enable
Click on Save and Exit.
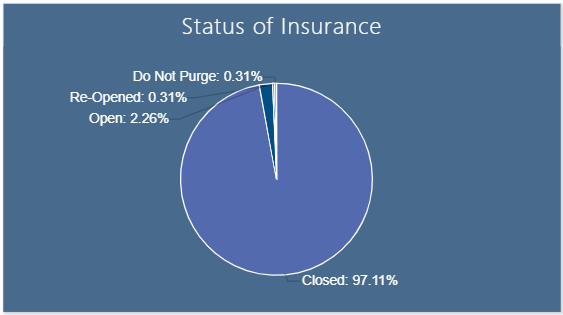
Status of Insurance: It displays the Status of Insurance like Open, Closed, Re-Opened and Do Not Purge.
From the Right vertical menu select the chart widget and enter the following details in Pie Chart Property.
Name: Status of Insurance

Dataset: Insurance.ds

Category Axis: Status

Value Column: File No

Aggregation: Count
Go to the Formatting Property and Enter the following details in General:
Color & Theme Property: #546aae,#034f84,#2f70c0,#43abda,#deeaee,#b1cbbb,#eea29a,#c94c4c,#ffef96,#bd5734,#a79e84,#50394c,#625750,#b2b2b2,#587e76,#f4e1d2
Enter the following details in Series:
Series General Properties >> Series Name: Status

Series Labels >> Color: #ffffff
Go to the Widget Setting and enter the details same as Top 10 Insurance Company by Coverage Type widget Property.
Click on Save and Exit.
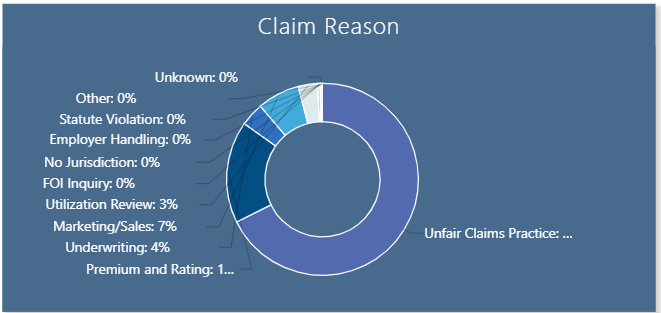
Claim Reason: It displays the Reason of Insurance claims.
From the Right vertical menu select the chart widget and enter the following details in Donut Chart Property.
Name: Claim Reason

Dataset: Insurance.ds

Category Axis: Reason

Value Column: File No

Aggregation: Count
Go to the Formatting Property and Enter the following details in General:
Color & Theme Property: #546aae,#034f84,#2f70c0,#43abda,#deeaee,#b1cbbb,#eea29a,#c94c4c,#ffef96,#bd5734,#a79e84,#50394c,#625750,#b2b2b2,#587e76,#f4e1d2
Enter the following details in Series:
Series General Properties >> Series Name: Claim Reason

Series Labels >> Color: #ffffff

Truncate: Enable
Go to the Widget Setting and enter the details same as Top 10 Insurance Company by Coverage Type widget Property.
Click on Save and Exit.
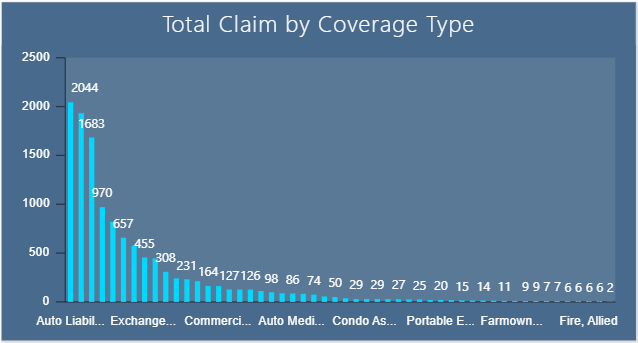
Total Claim by Coverage Type: It displays the Total Insurance claims collected by Coverage Type.
From the Right vertical menu select the chart widget and enter the following details in Clustered Column Chart Property.
Name: Total Claim by Coverage Type

Dataset: Insurance.ds

Category Axis: Coverage

Value Column: File No

Aggregation: Distinct Count
Go to the Formatting Property and Enter the following details in General:
Color & Theme Property: #546aae,#034f84,#2f70c0,#43abda,#deeaee,#b1cbbb,#eea29a,#c94c4c,#ffef96,#bd5734,#a79e84,#50394c,#625750,#b2b2b2,#587e76,#f4e1d2

Chart Sorting Based on Value: Descending

Chart Background Area >> Background Opacity: 0.1
Enter the following details in Category Axis:
Category Labels >> Alignment: Trim

Category Font Property >> Color: #ffffff
Enter the following details in Value Axis:
Value Font Property >> Color: #ffffff
Enter the following details in Series:
Series General Properties >> Series Name: Coverage Type

Series Value Labels Position: Enable Value Labels

Font Color: #ffffff

Decimal Place: 0

Alignment: Hide

Truncate: Enable
Go to the Widget Setting and enter the details same as Top 10 Insurance Company by Coverage Type widget Property.
Click on Save and Exit.
Insurance Company by Recovery Rate: It displays Recovery Rate of Insurance Company in Percentage.
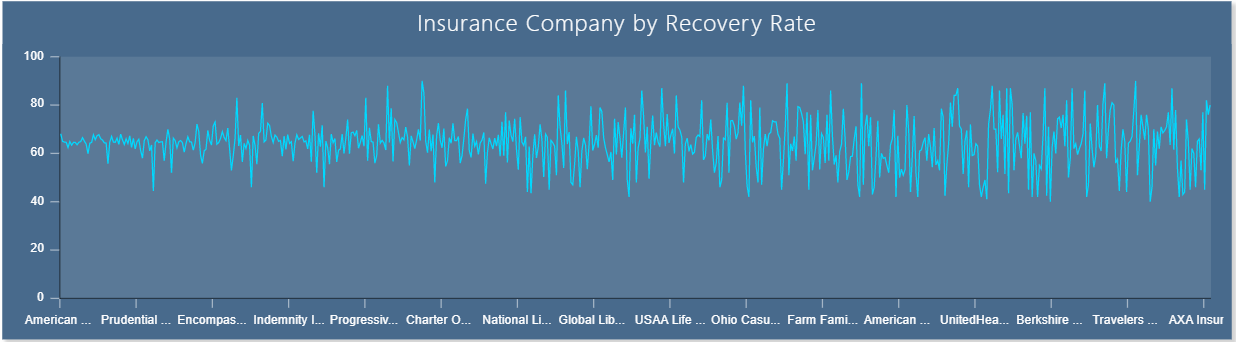
From the Right vertical menu select the chart widget and enter the following details in Line Chart Property.
Name: Insurance Company by Recovery Rate

Dataset: Insurance.ds

Category Axis: Company

Value Column: Recovery

Aggregation: Avg
Go to the Formatting Property and Enter the following details in General:
Color & Theme Property: #546aae,#034f84,#2f70c0,#43abda,#deeaee,#b1cbbb,#eea29a,#c94c4c,#ffef96,#bd5734,#a79e84,#50394c,#625750,#b2b2b2,#587e76,#f4e1d2

Chart Background Area >> Background Opacity: 0.1

Chart Tooltip >> Tooltip Text: ${series.name} ${point.x} : ${point.y}%
Enter the following details in Category Axis:
Category Labels >> Alignment: Trim

Category Font Property >> Color: #ffffff

Category Ticks >> Color: #ffffff
Enter the following details in Value Axis:
Value Font Property >> Color: #ffffff

Value Ticks >> Color: #ffffff
Enter the following details in Series:
Series General Properties >> Series Name: Insurance Company
Go to the Widget Setting and enter the details same as Top 10 Insurance Company by Coverage Type widget Property.
Click on Save and Exit.
Open Year & Month Filter: It displays the Claim Open Month & Year information.

From the top right corner of the dashboard click on the filter Icon.
Click on ![]() Icon to add filter and enter following details in it.
Icon to add filter and enter following details in it.
Name: Open Year & Month

Event: On Change
Click on the Setting icon and enter the following details in the Filter widget.
Source: Dataset

Display Type: Multi Select

Dataset: Insurance

Column Name: Opened

Show Name in Widget: Disable
Enter the following details in the Link Filter and widget Property.
Layer: Layer1

Tab: Insurance

Widgets: (Select all the widgets one by one and link the Opened with all the widgets)
Click on ![]() Icon to add filter and enter following details in it.
Icon to add filter and enter following details in it.
Close Year & Month Filter: It displays the Claim Close Month & Year Informaton.

Name: Close Year & Month

Event: On Change
Click on the Setting icon and enter the following details in the Filter widget.
Source: Dataset

Display Type: Multi Select

Dataset: Insurance

Column Name: Closed

Show Name in Widget: Disable
Enter the following details in the Link Filter and widget Property.
Layer: Layer1

Tab: Insurance
Widgets: (Select all the widgets one by one and link the Closed with all the widgets)
Status Filter: It displays the list of Insurane Status.

Name: Status

Event: On Change
Click on the Setting icon and enter the following details in the Filter widget.
Source: Dataset

Display Type: Multi Select

Dataset: Insurance

Column Name: Status

Show Name in Widget: Disable
Enter the following details in the Link Filter and widget Property.
Layer: Layer1

Tab: Insurance
Widgets: (Select all the widgets one by one and link the Status with all the widgets)
Coverage Filter: It displays the list type of Insurance Coverages.

Name: Status

Event: On Change
Click on the Setting icon and enter the following details in the Filter widget.
Source: Dataset

Display Type: Multi Select

Dataset: Insurance

Column Name: Status

Show Name in Widget: Disable
Enter the following details in the Link Filter and widget Property.
Layer: Layer1

Tab: Insurance

Widgets: (Select all the widgets one by one and link the Status with all the widgets)
Company Filter: It displays the list Insurance Company.

Name: Company

Event: On Change

Click on the Setting icon and enter the following details in the Filter widget.

Source: Dataset

Display Type: Multi Select

Dataset: Insurance

Column Name: Company

Show Name in Widget: Disable
Enter the following details in the Link Filter and widget Property.
Layer: Layer1

Tab: Insurance

Widgets: (Select all the widgets one by one and link the Company with all the widgets)

Go to the filter View Property, Click on the + icon of Open Year & Month, CLose Year & Month and Status filter to add a filter in the Insurance Tab of the dashboard.
Click on Save and Exit.
Overview / Detail Data Button: Custom Visualization

From the right vertical menu select the Custom Visualization Widget and update the Properties, as below:
In HTML Properties enter the HTML code Provided in the overview-detaildata button file.
Go to the Widget Setting and enter the details same as Insurance Company KPI widget Property.
Click on Preview and Save and Exit.
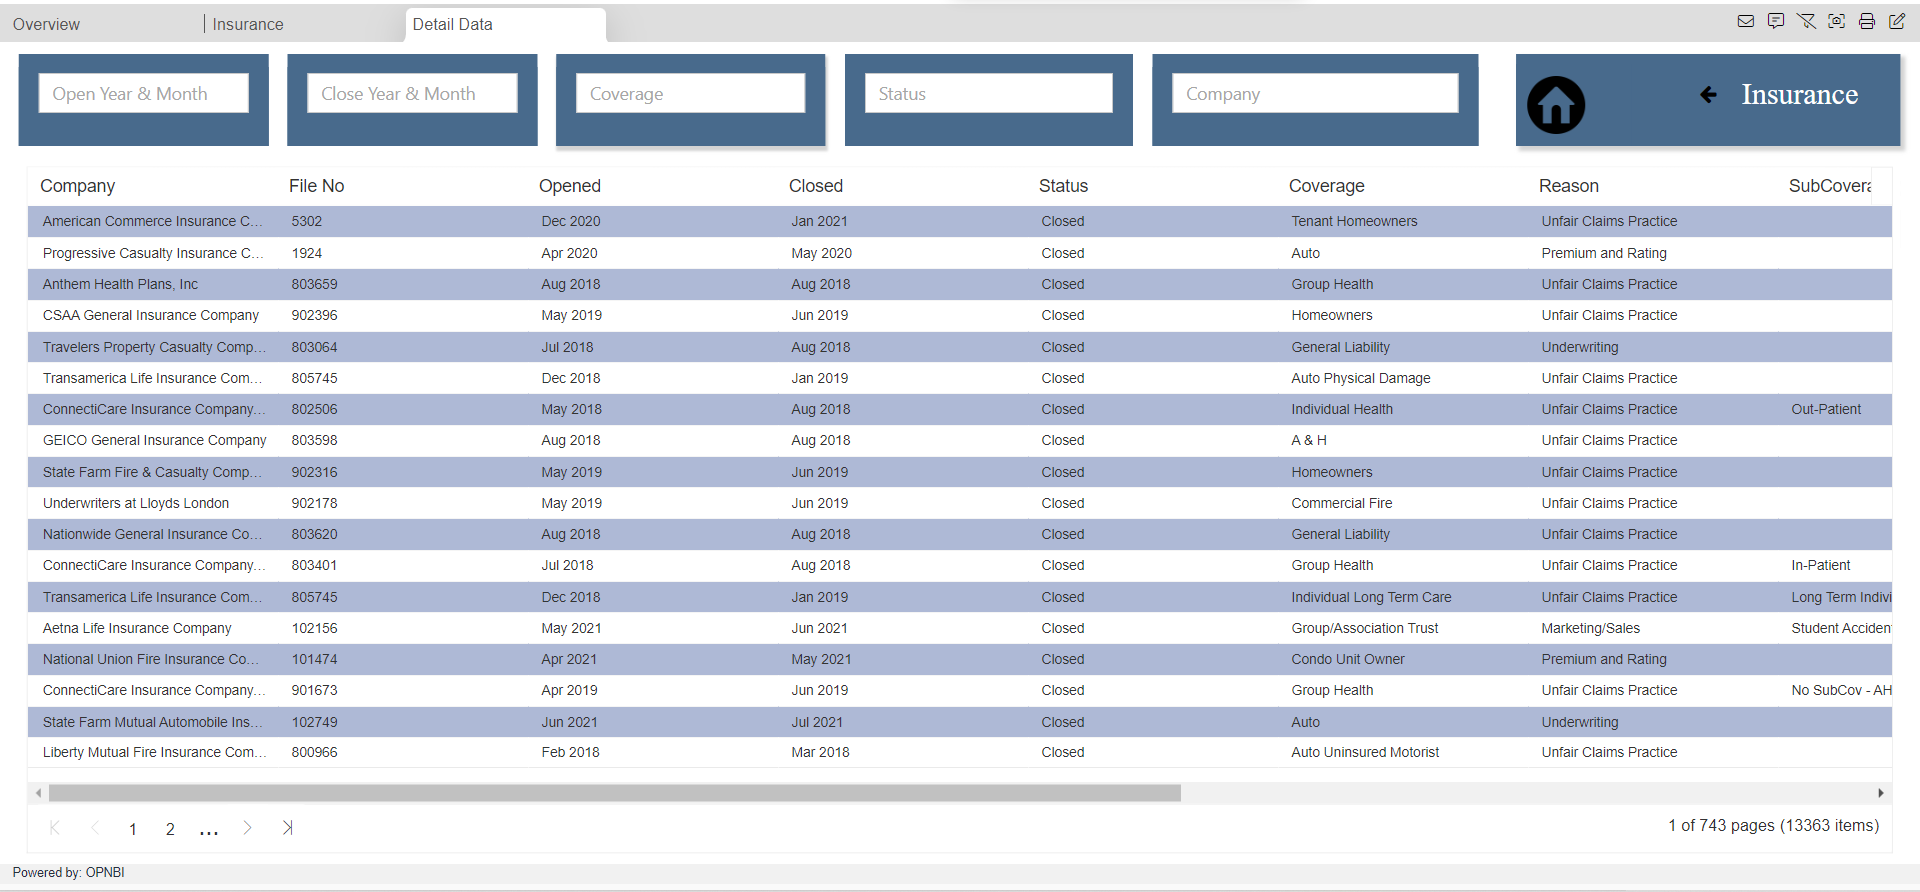
Detail Data Tab:
Go to the filter View Property, Click on the + icon of Open Year & Month, CLose Year & Month, Coverage, Status and Company filter to add a filter in the Insurance Tab of the dashboard.
Detail Data Table: It displays all the Detail information about Insurance.
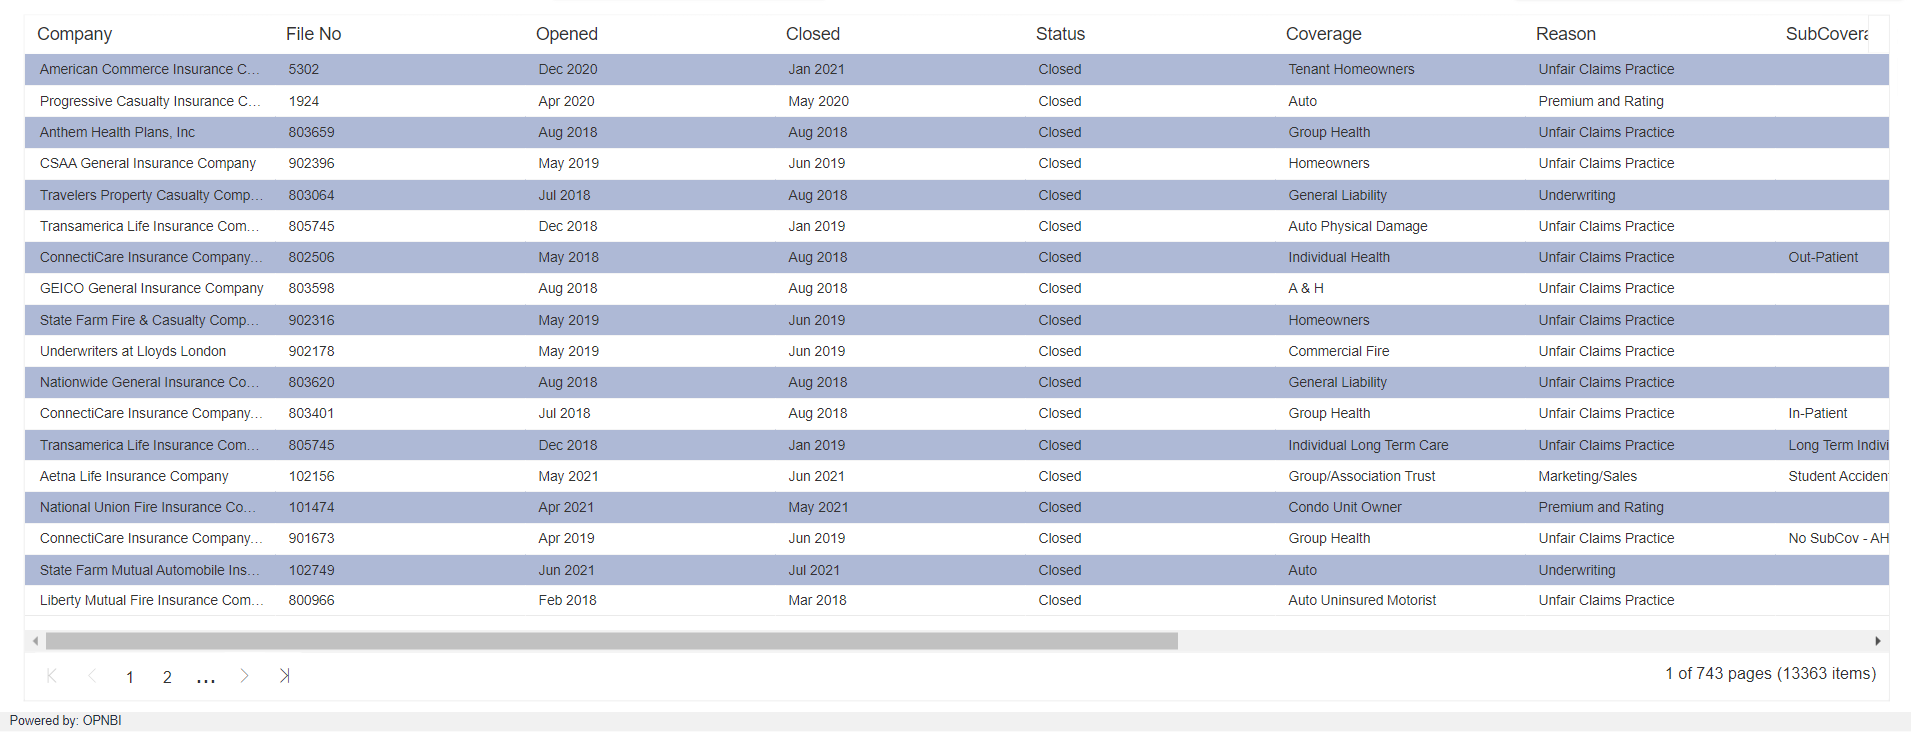
From the Right vertical menu select the Table widget and enter the following details in General Property:
Name: Detail Data

Dataset: Insurance.ds

Dataset Column Select all the fields.
Go to the Formatting Property and enter the details in Miscellaneous Properties below:
Pagination: Enable

Pagination Size: 18
Enter the details in Theme Properties below:
Table Header Properties >> Header font Size: 14

Table Body Properties >> Odd Row Background color: #aeb9d6
Go to the Widget Setting and enter the details same as Insurance Company KPI widget Property.
Click on Save and Exit.
Home Icon:

From the right vertical menu add Custom Visualization Widget in the dashboard.
Enter the code in HTML Property HTML >> home icon file.
Enter the code in JavaScript Property (JavaScript >> home icon file)
Enter the code in CSS Property (CSS code provided in home icon file)
Go to the Widget Setting and enter the details same as Insurance Company KPI widget Property.
Title Properties: Disable Show Title
Click on Save and Exit.
Insurance Button:

From the right vertical menu add Custom Visualization Widget in the dashboard.
Enter the code in HTML Property (HTML code provided in HTML >> insurance file)
Go to the Widget Setting and enter the details same as Insurance Company KPI widget Property.
Title Properties: Disable Show Title
Click on Save and Exit.